Is Pacific Heights as rare and competitive as its postcard views make it feel? If you have seen mixed headlines about prices and timing, you are not alone. In a small, luxury market like this, one or two big sales can move the numbers. In this deep dive, you will learn what current metrics really mean, which blocks drive premiums, how to price or bid with confidence, and what to watch in taxes and closing costs. Let’s dive in.
Inside the Pacific Heights Real Estate Market in 2026
Reported medians in early 2026 sit in a broad band near 1.8 to 2.4 million, depending on the source and timeframe. Price per square foot often ranges around 1,200 to 1,450. Because transaction counts are low, short-window medians swing when a few large deals hit.
Inventory is thin. Active listings typically number in the low dozens at any given time, and closed sales in a month rarely exceed the low tens. Days on market has hovered around two months in recent snapshots, with meaningful variation by price tier and property type.
The luxury lane can be even quieter. Local reporting notes that some of the largest Pacific Heights trades occur off market, so headline stats may understate top-tier activity. That is why you want to track 6 to 12 months of comps by micro-market, not a single monthly median.
Why medians swing here
- Pacific Heights often posts a handful of very large sales that skew medians for weeks. Local coverage shows high-end homes, including Broadway addresses, closing privately and at very high prices. For context, an off-market Broadway sale around 42 million was reported in 2025, a reminder that a few trophy deals can reshape the chart for a season. See coverage of off-market activity on so-called Billionaires’ Row for color on this dynamic: local off-market coverage.
- With fewer listings and buyers than broader city averages, one or two sales near the top can lift a neighborhood-wide median, even if most homes are trading in a different band. Local reporting on Pacific Heights highlights how small sample sizes create lumpy data: neighborhood sales volatility.
Micro-markets that move the needle
Broadway and the Gold Coast
These blocks command the neighborhood’s top prices for view, lot size, privacy, and prestige. Off-market deals and bespoke marketing are common. For a sense of scale and privacy trends, see the Chronicle’s piece on high-end off-market trades: Billionaires’ Row coverage.
Parkside near Lafayette and Alta Plaza
Homes facing or adjoining these parks often earn premiums for light, greenery, and usable outdoor space. Buyers prize park adjacency for daily living and long-term resale potential. View lines and orientation matter as much as distance.
Pacific, Jackson, and Vallejo corridors
Top-of-hill addresses with direct Bay and Golden Gate sightlines often achieve higher per square foot. Orientation and floor elevation can swing value by large percentages. For a visual of how views and layout drive pricing, review these market-trend briefs that highlight view premiums and floor plan importance: premium drivers overview.
Lower Pacific Heights context
South of California Street, you will find a denser mix of multi-unit buildings and more condo options. Pricing profiles and buyer pools differ from the hilltop single-family market, so comp selection must stay hyper local.
What buyers pay for here
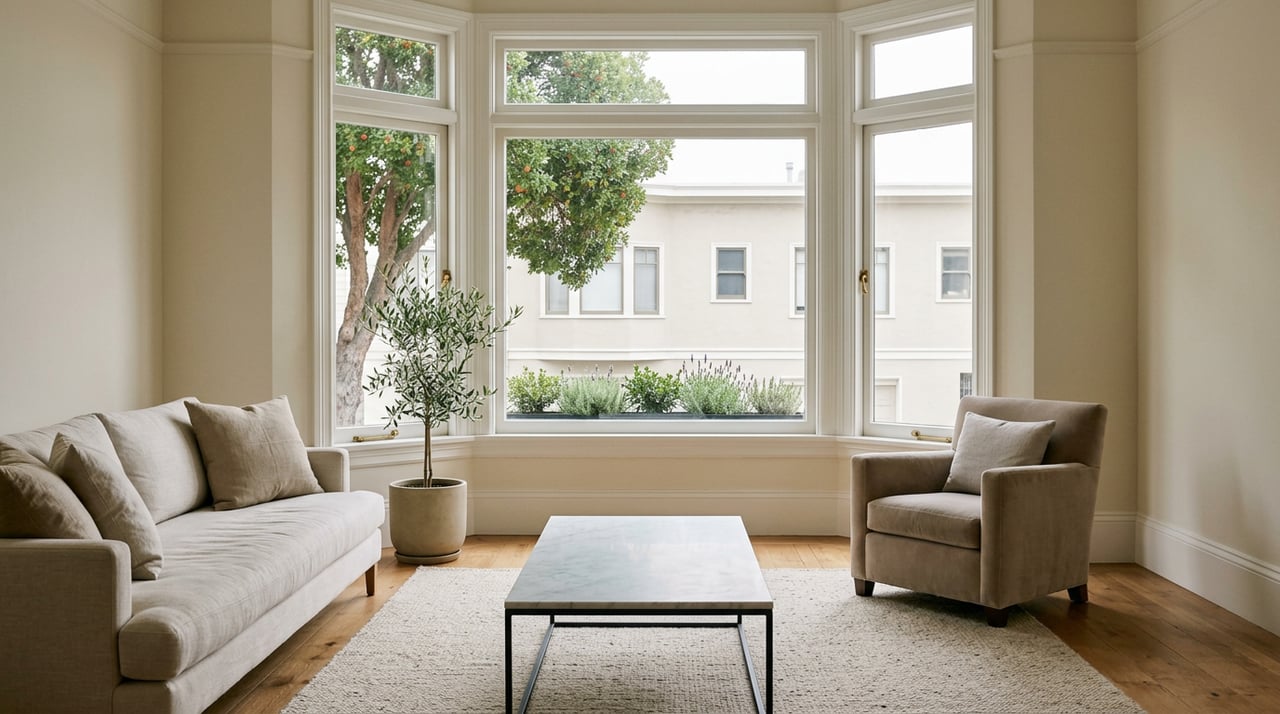
- Views and orientation. Bay and bridge views with strong east, west, or north exposures remain top-tier value drivers. Even partial or framed views can lift pricing. See market commentary on view premiums and floor plan function: premium drivers overview.
- Usable square footage and layout. Large rooms, high ceilings, and a logical flow command premiums, especially in grand homes.
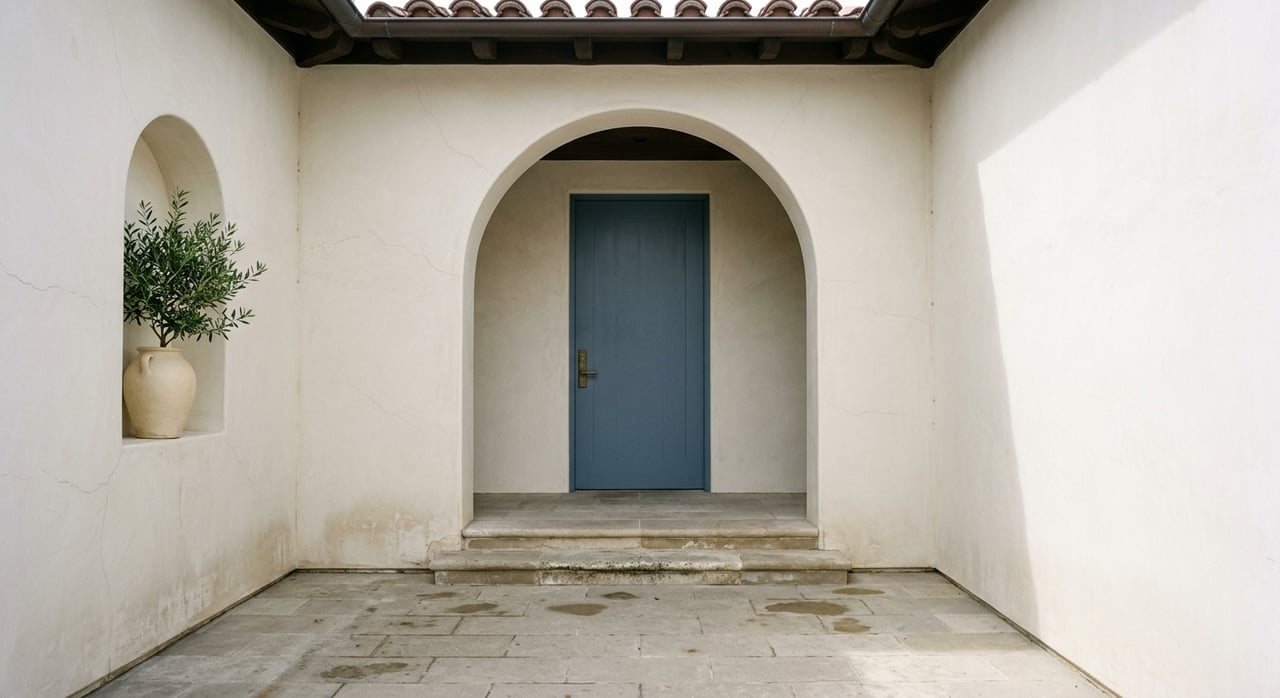
- Condition and systems. Turnkey renovations with high-end finishes and updated building systems typically outperform fixers.
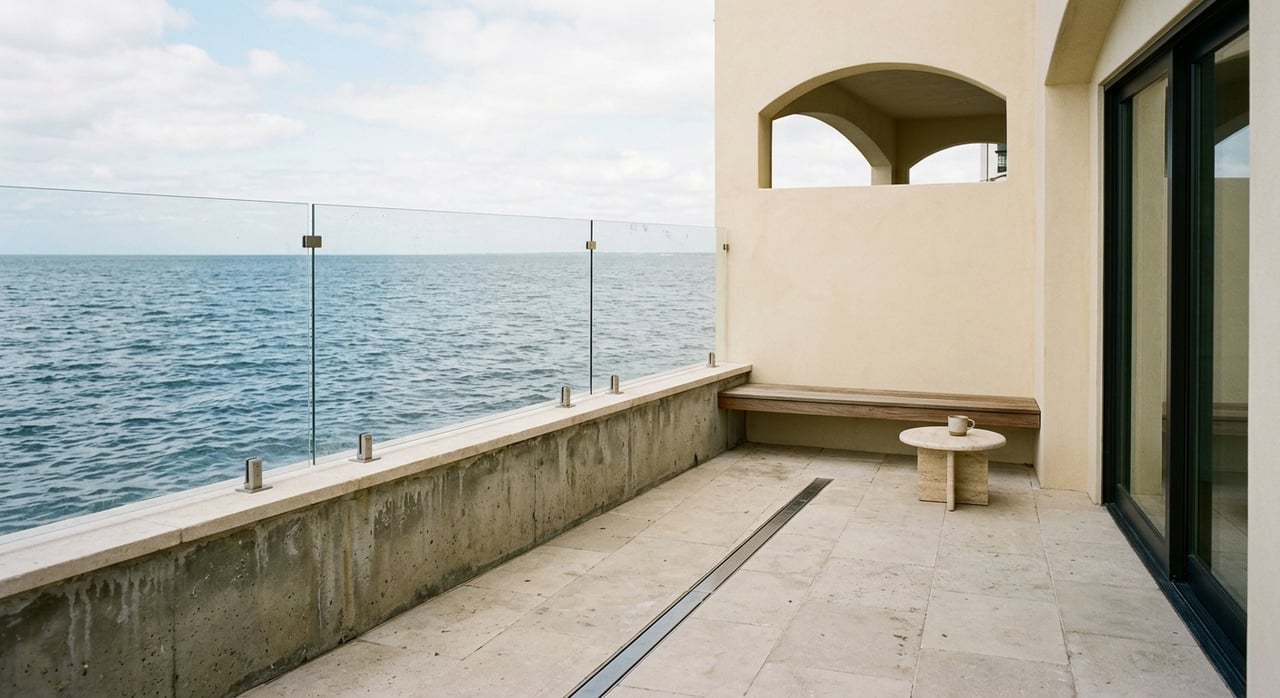
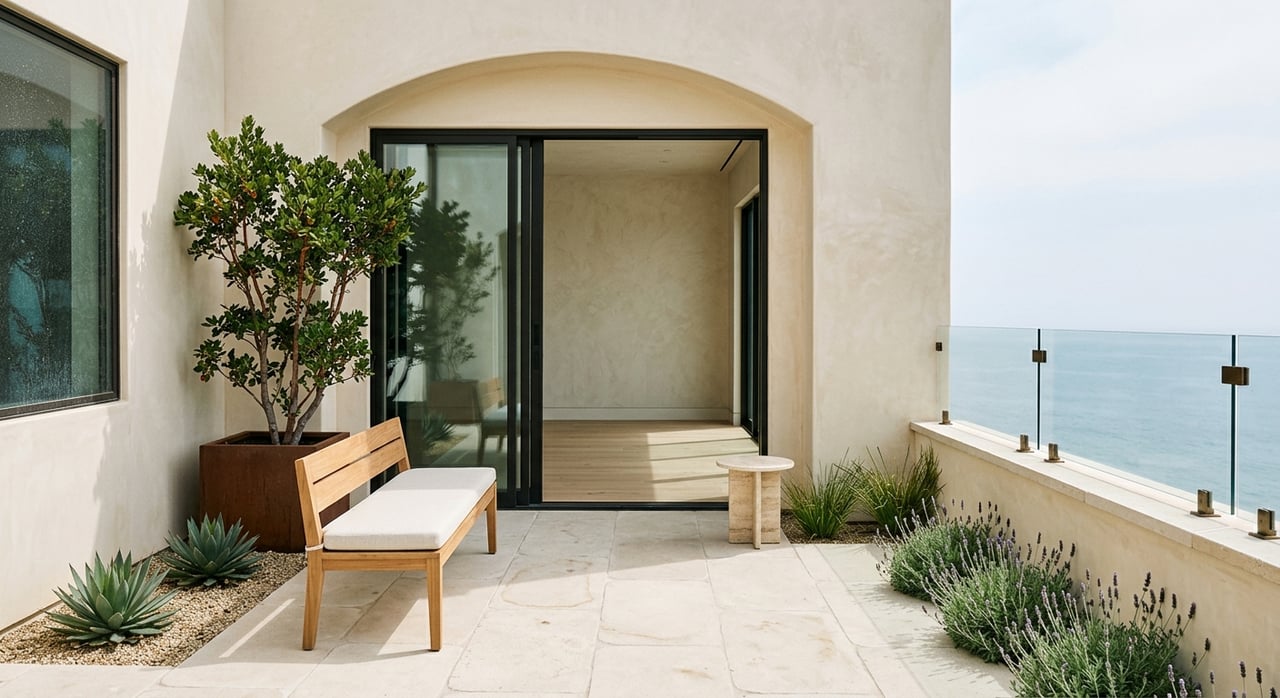
- Parking and private outdoor space. Garages, driveways, gardens, terraces, and roof decks are scarce and valuable.
- Condo amenities and coverage. In full-service buildings, doorman service, storage, onsite management, and whether earthquake insurance is included in the HOA can justify higher per square foot.
Regulatory and cost items to model:
- Property tax basics. California’s base property tax rate is about 1 percent of assessed value, with capped annual increases. Local bonds and assessments can add to the effective rate. Learn more about how this works in San Francisco: Prop 13 overview.
- Transfer tax at closing. San Francisco’s transfer tax is progressive, with higher brackets at larger prices. It is a significant line item for multi-million-dollar sales. Review the city’s tiered structure and background here: SF transfer tax explainer and broader context on rising transfer taxes in California: transfer tax guide.
Strategies for sellers
- Price by micro-market, not a single median. Build your CMA around the same block, park face, and product type, using 6 to 12 months of comps. Thin sales can make monthly medians misleading.
- Invest in presentation. Pre-list inspections, targeted repairs, professional staging, and top-tier photography help you capture attention in a limited-inventory, luxury setting. Industry roundups show staging can shorten time on market and modestly lift offers: staging impact overview.
- Match the marketing to the moment. For family-size homes in active sub-markets, a well-calibrated list price can create early competition. For ultra-luxury or privacy-driven listings, consider a controlled or private campaign to reach qualified buyers while preserving discretion. Off-market activity is well documented in this neighborhood: off-market trend context.
- Time it wisely. Spring often sees stronger buyer activity, but ultra-low inventory in other seasons can also produce standout results. Weigh local seasonality and current supply before defaulting to spring: seasonality insights.
- Model net proceeds early. Pre-plan for San Francisco’s progressive transfer tax in your net sheet to avoid surprises at the high end: SF transfer tax explainer.
Strategies for buyers
- Get fully underwritten early. Arrive with pre-approval or proof of funds and a local lender who understands San Francisco’s condo standards and HOA reviews. For rate context, the Freddie Mac PMMS averaged near the low 6 percent range in early February 2026: weekly rate survey.
- Expect cash at the top. Many ultra-high offers are cash or near-cash, which sellers value for speed and certainty. If you are financing, plan a strong package and discuss appraisal-gap strategies, but weigh risk on older homes carefully. Local coverage highlights how cash and private trades shape the very top of the market: luxury closing patterns.
- Structure a clean offer, not a reckless one. Clarify contingencies and timelines. If you consider shortening or waiving contingencies to compete, pair that with pre-offer inspections or targeted expert evaluations on foundations, seismic retrofits, and roofs.
- For condos, dig into the docs. Review reserve studies, pending assessments, and whether earthquake insurance is included. Services like doorman, storage, and onsite management often justify price differences.
Pricing bands and navigating volatility
Because one or two trophy sales can skew the picture, anchor decisions to a 6 to 12 month comp set that matches your product type and micro-location. For a sharper view, track sales by bands, such as under 2 million, 2 to 5 million, and over 5 million, and compare days on market and price per square foot within each band. That approach helps you price or bid confidently without chasing a noisy monthly median.
The bottom line
Pacific Heights is a precision market. Views, block, orientation, and product type can swing value by meaningful margins, while low inventory and occasional private trades create headline volatility. With the right data, presentation, and offer structure, you can move decisively and still protect your interests. If you want a block-by-block pricing review or discreet access, reach out to Michelle Harris Properties to Request a Private Market Review.
FAQs
What is the price range in early 2026?
- Reported medians cluster around 1.8 to 2.4 million, with many homes trading above or below that depending on property type, block, and views. Price per square foot often falls near 1,200 to 1,450.
How long do Pacific Heights homes take to sell?
- Recent snapshots suggest around two months on market on average, but timing varies widely by price tier, presentation, and whether you are near parks, view lines, or the Gold Coast.
Which features add the most value in Pacific Heights?
- Views, usable square footage and layout, high-end renovations, parking, private outdoor space, and full-service condo amenities are top value drivers.
How does San Francisco’s transfer tax affect my sale?
- The city’s progressive transfer tax increases at higher price brackets, so it can be a major cost in multi-million-dollar deals; model it early: SF transfer tax explainer.
Are off-market sales common at the high end?
- They are not unusual. Local reporting documents frequent private trades in the luxury tier, especially along Broadway and neighboring blocks: off-market trend context.