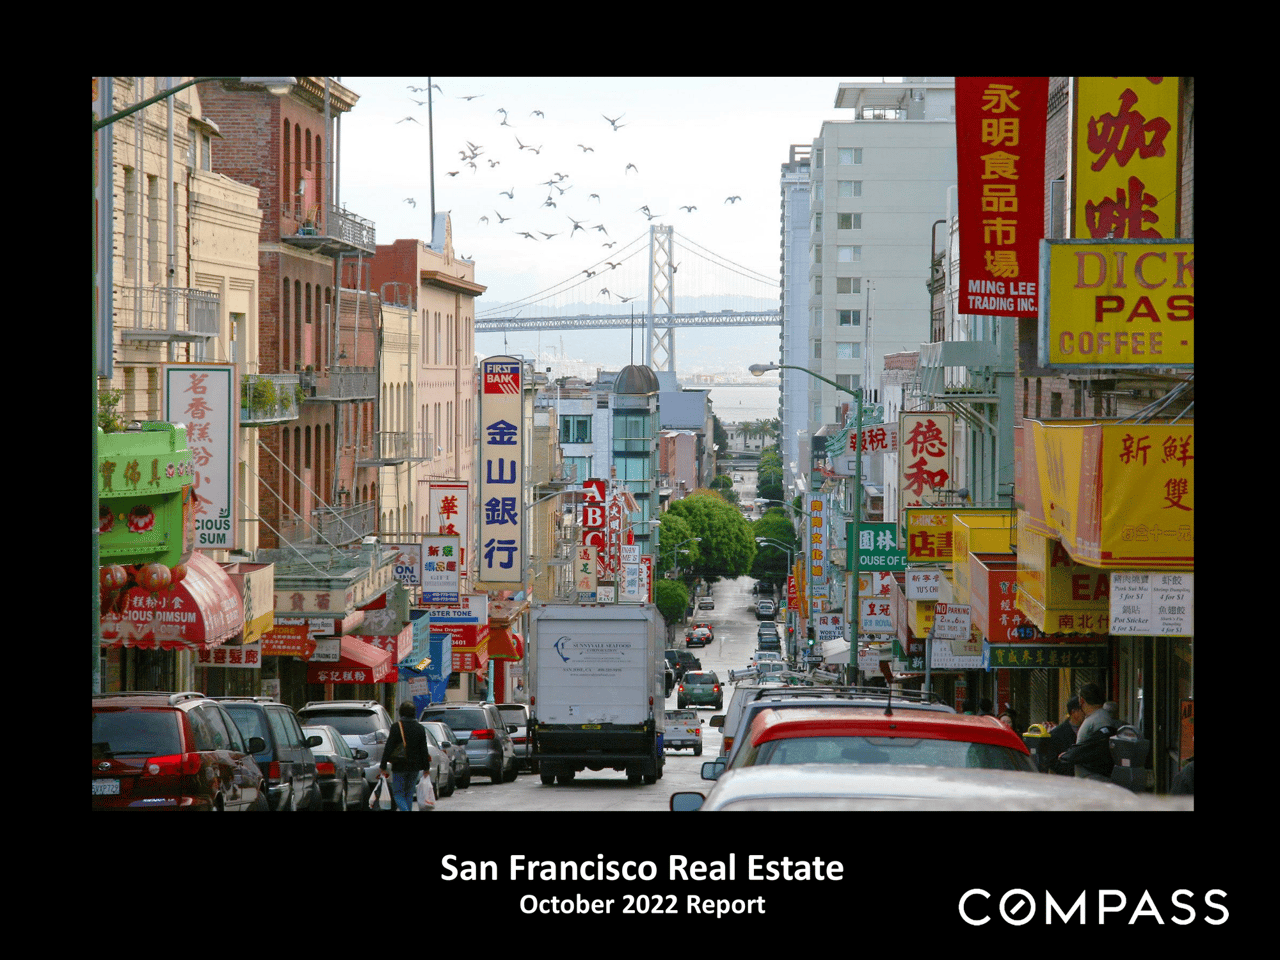
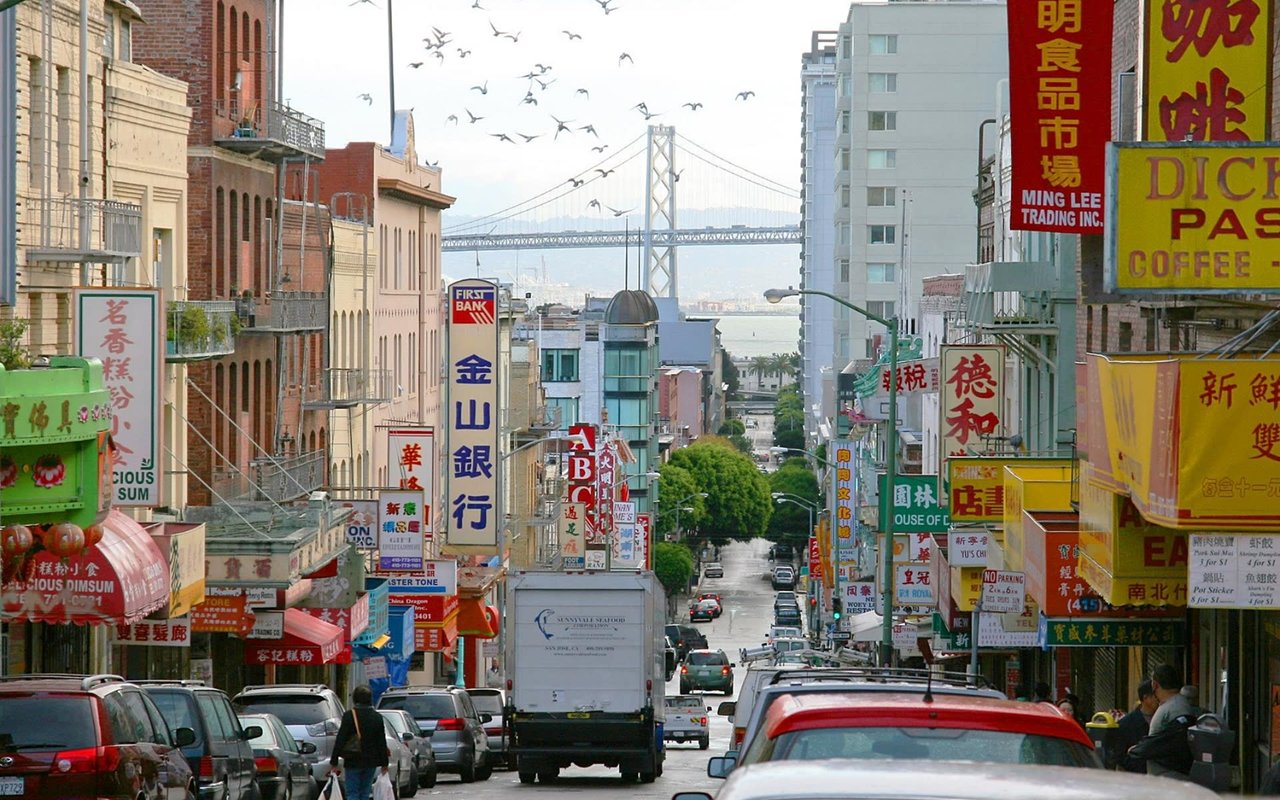
San Francisco real estate October 2022 report cover featuring a Chinatown street and the Bay Bridge.
Market report text about Bay Area third-quarter 2022 housing trends, with the Compass logo.
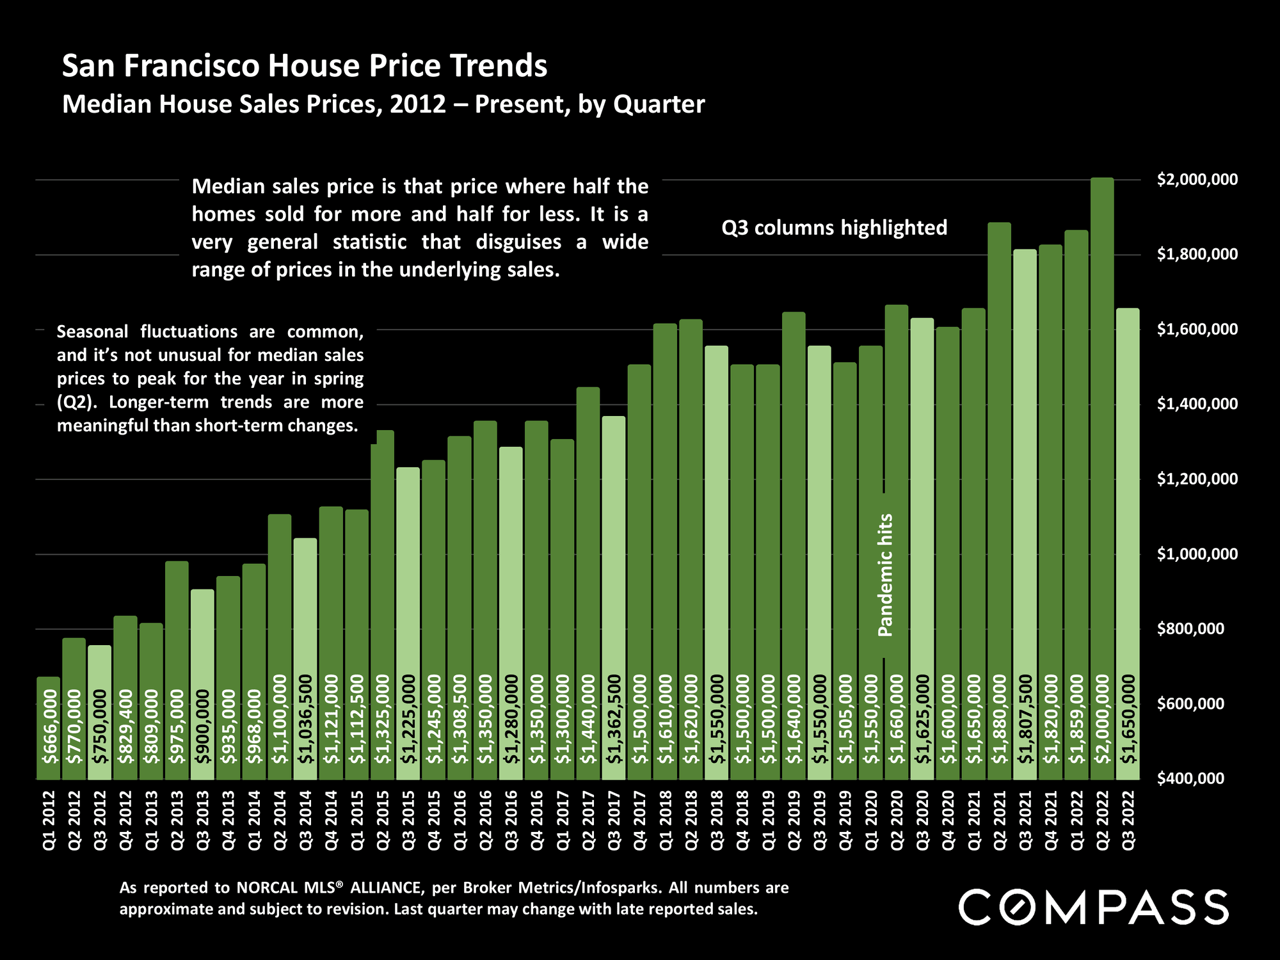
San Francisco quarterly median home sale prices, 2012–2022, shown as green bars with Q3 highlighted.
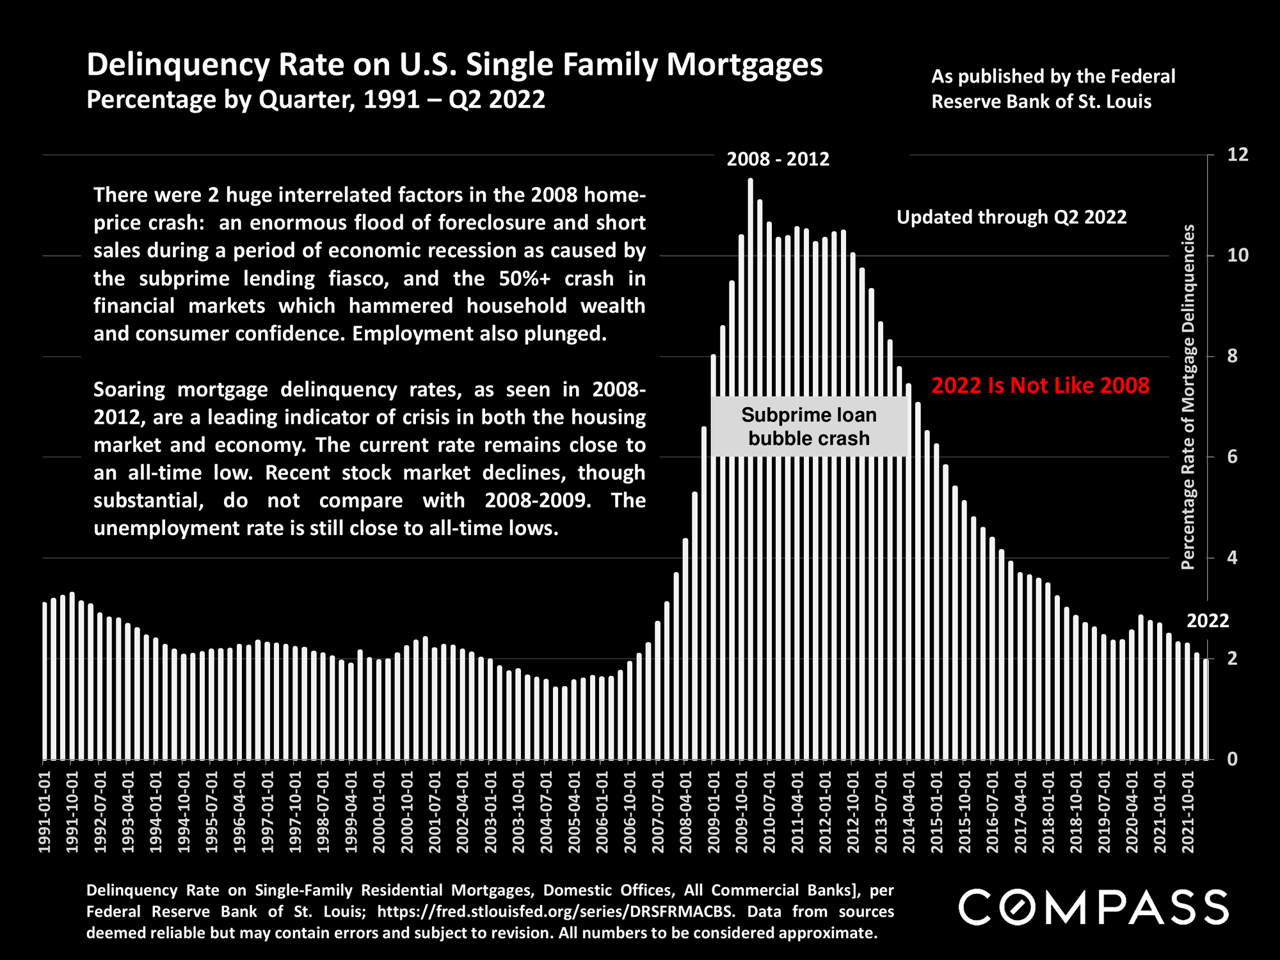
Chart of U.S. single-family mortgage delinquency rates, peaking during 2008–2012 and remaining low through Q2 2022.
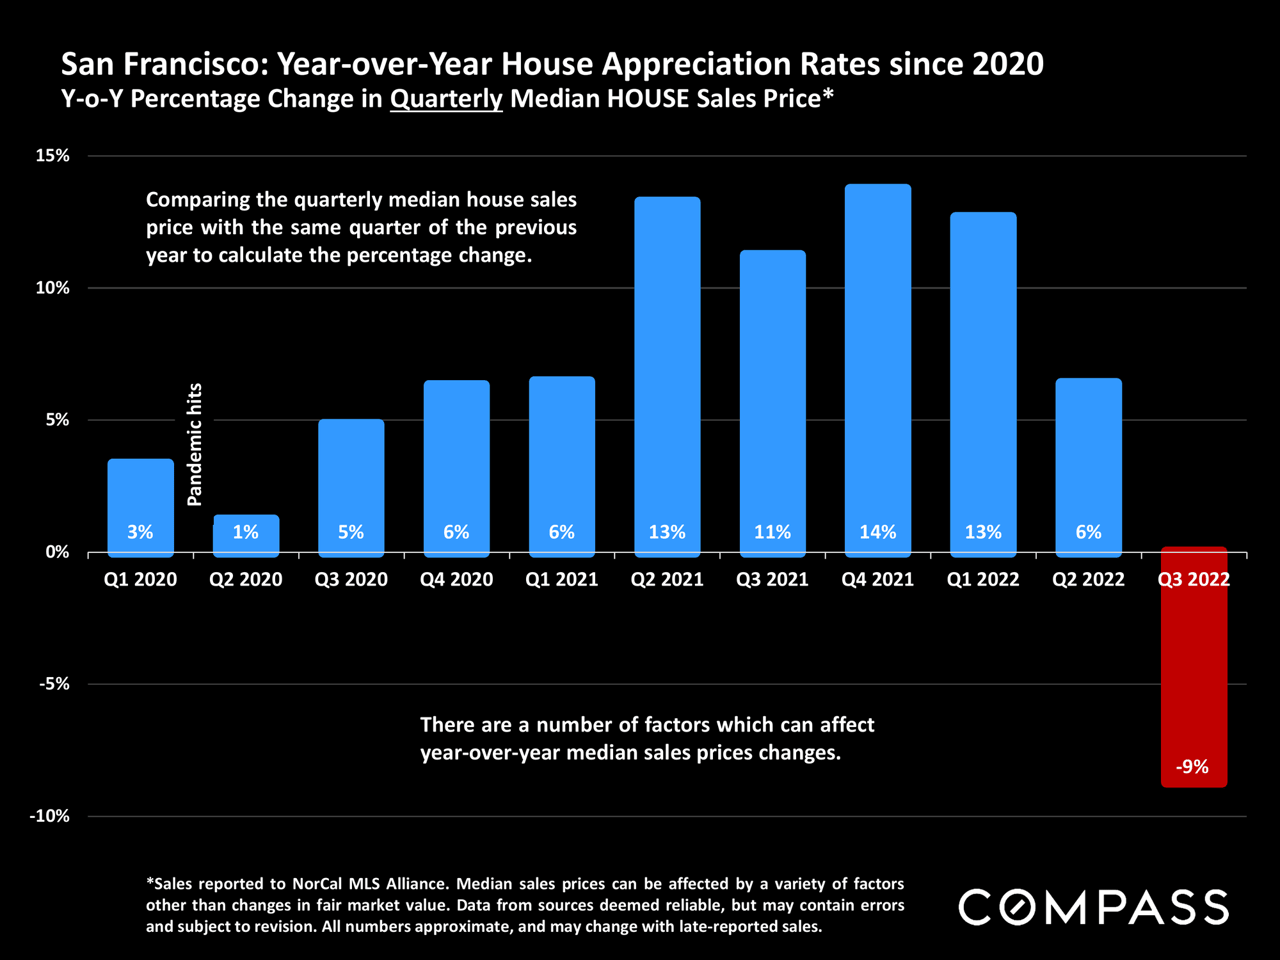
Chart of San Francisco quarterly home price changes, peaking at 14% in Q4 2021 and falling to -9% in Q3 2022.
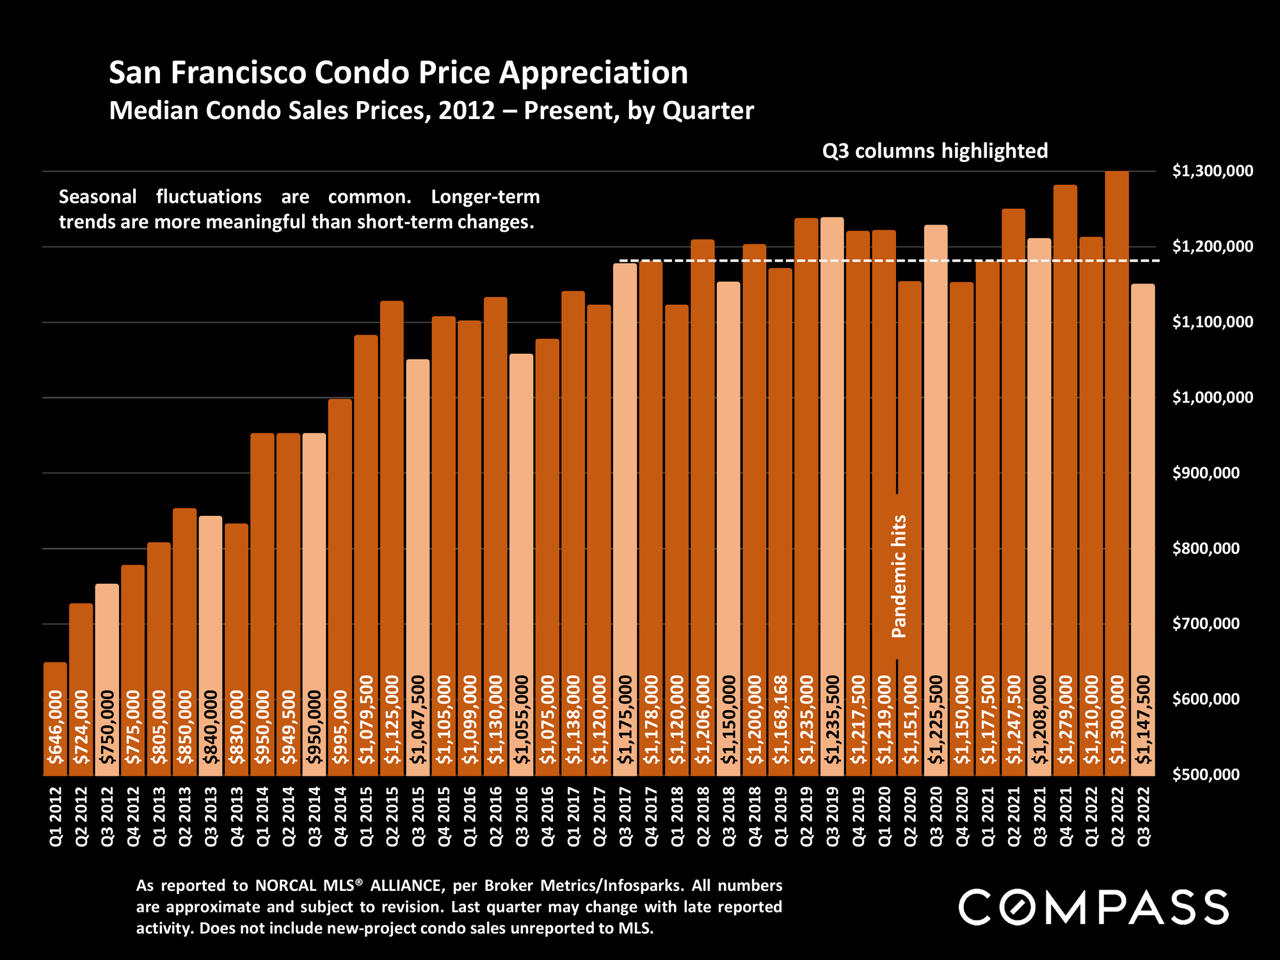
Chart of San Francisco condo prices by quarter, 2012–2022, showing an overall upward trend with Q3 bars highlighted.
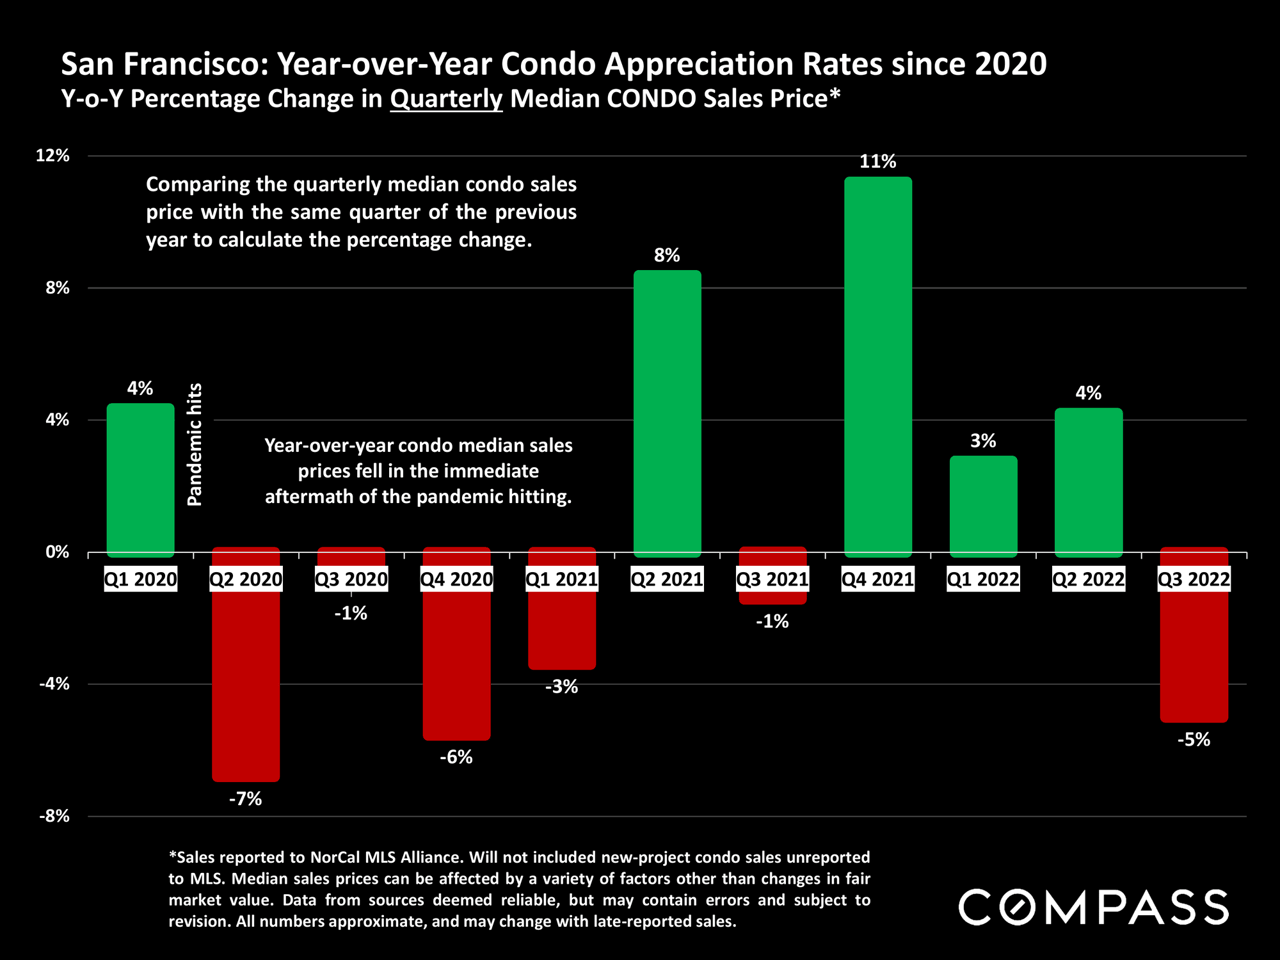
Chart showing San Francisco condo appreciation rates from Q1 2020 to Q3 2022.
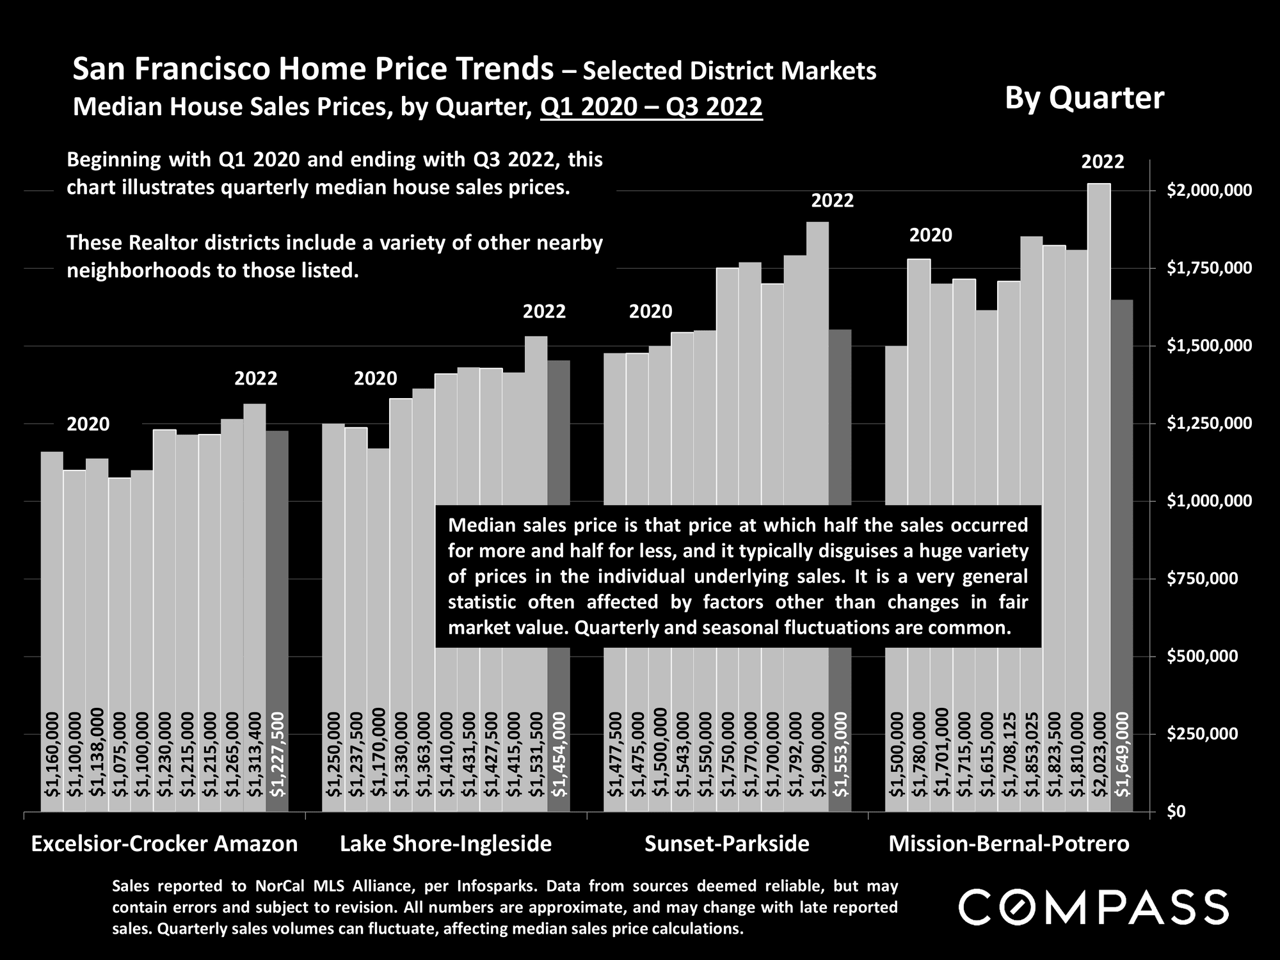
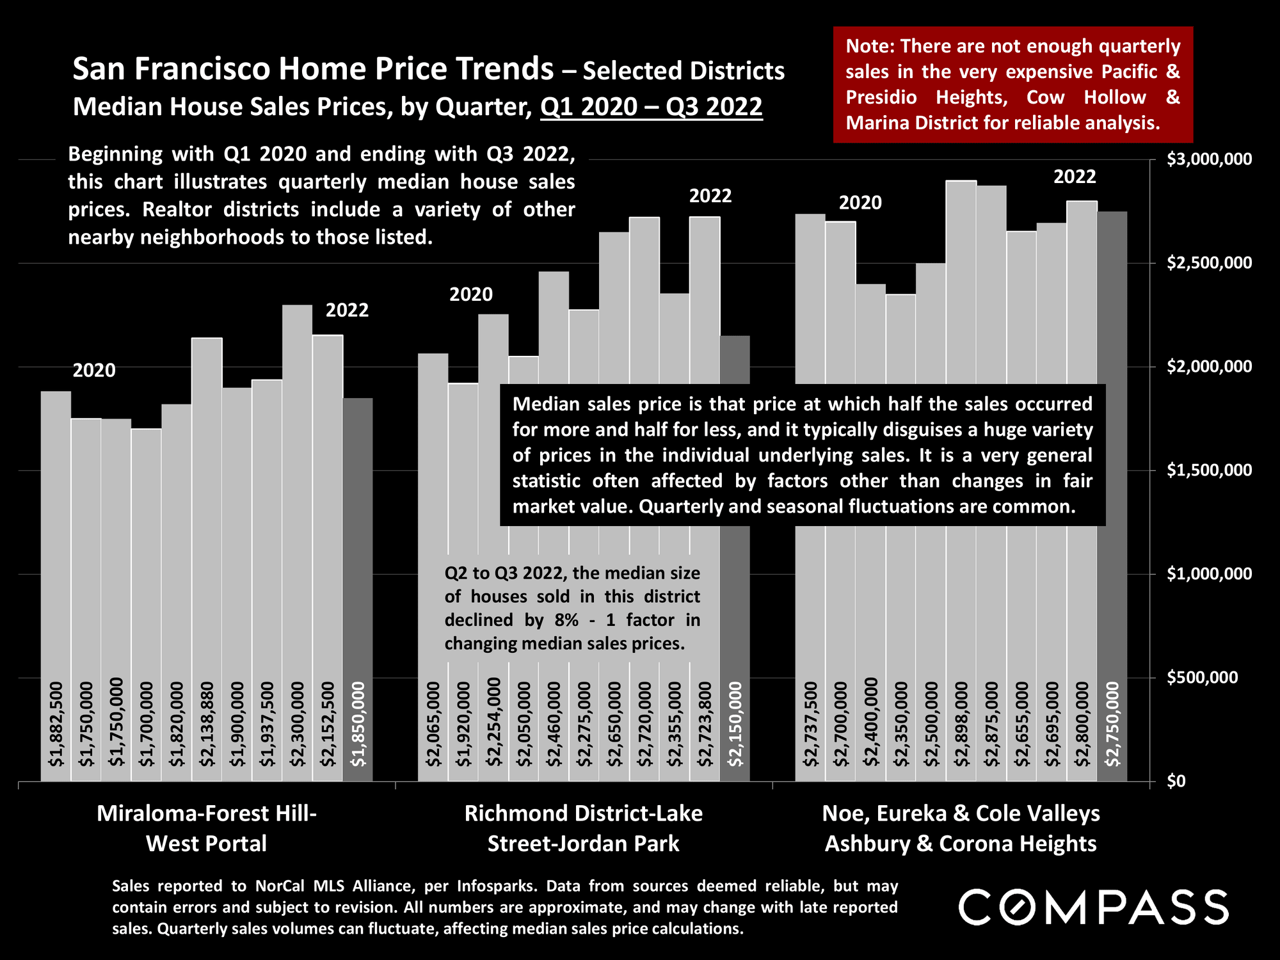
Bar chart comparing quarterly median home prices across four San Francisco district markets, Q1 2020 to Q3 2022.
San Francisco quarterly home price chart comparing median sale prices across three neighborhood groups, 2020–2022.
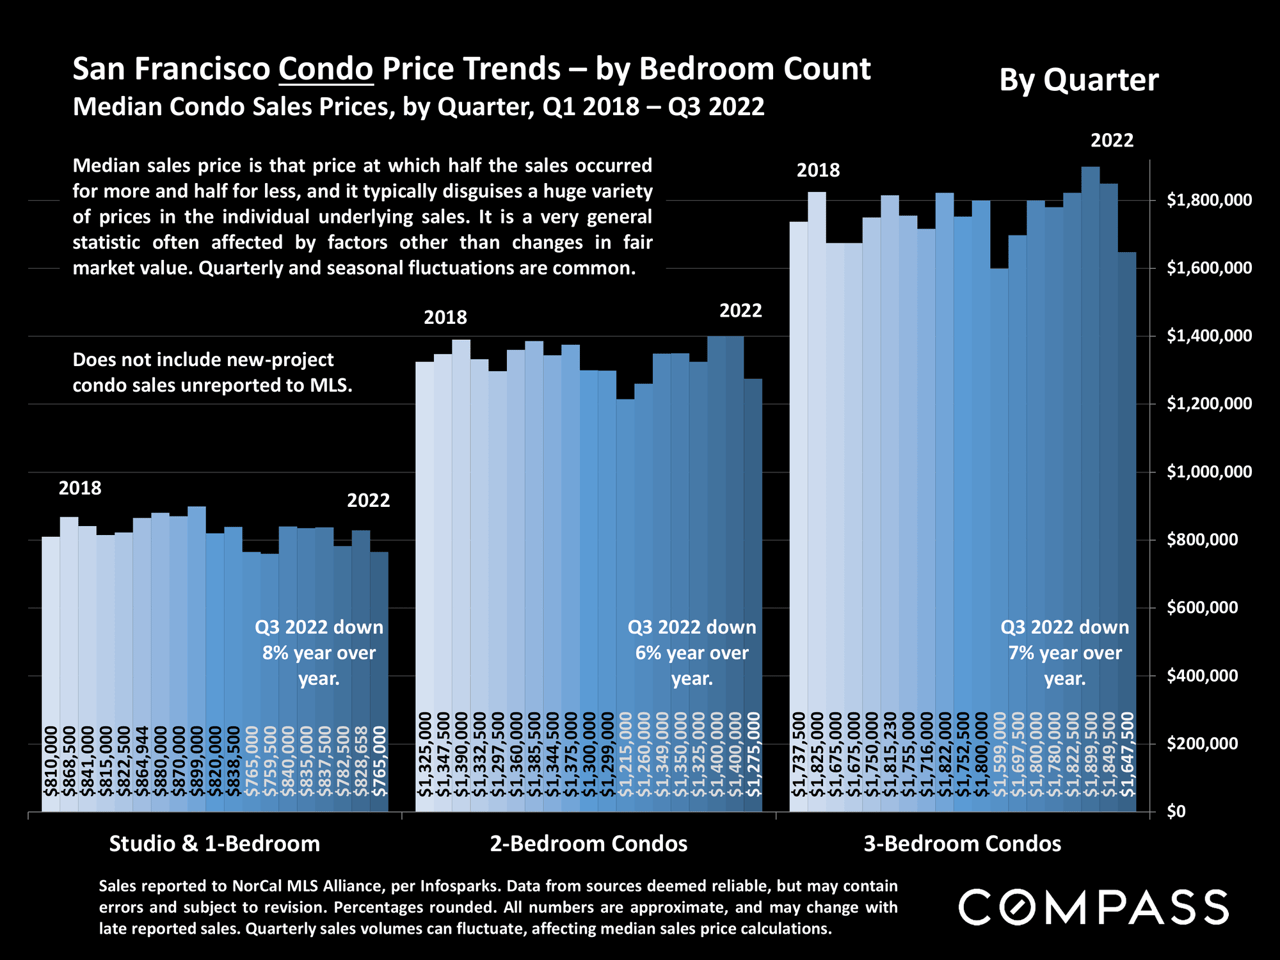
Chart of San Francisco condo prices by bedroom count, showing Q3 2022 year-over-year declines across all three groups.
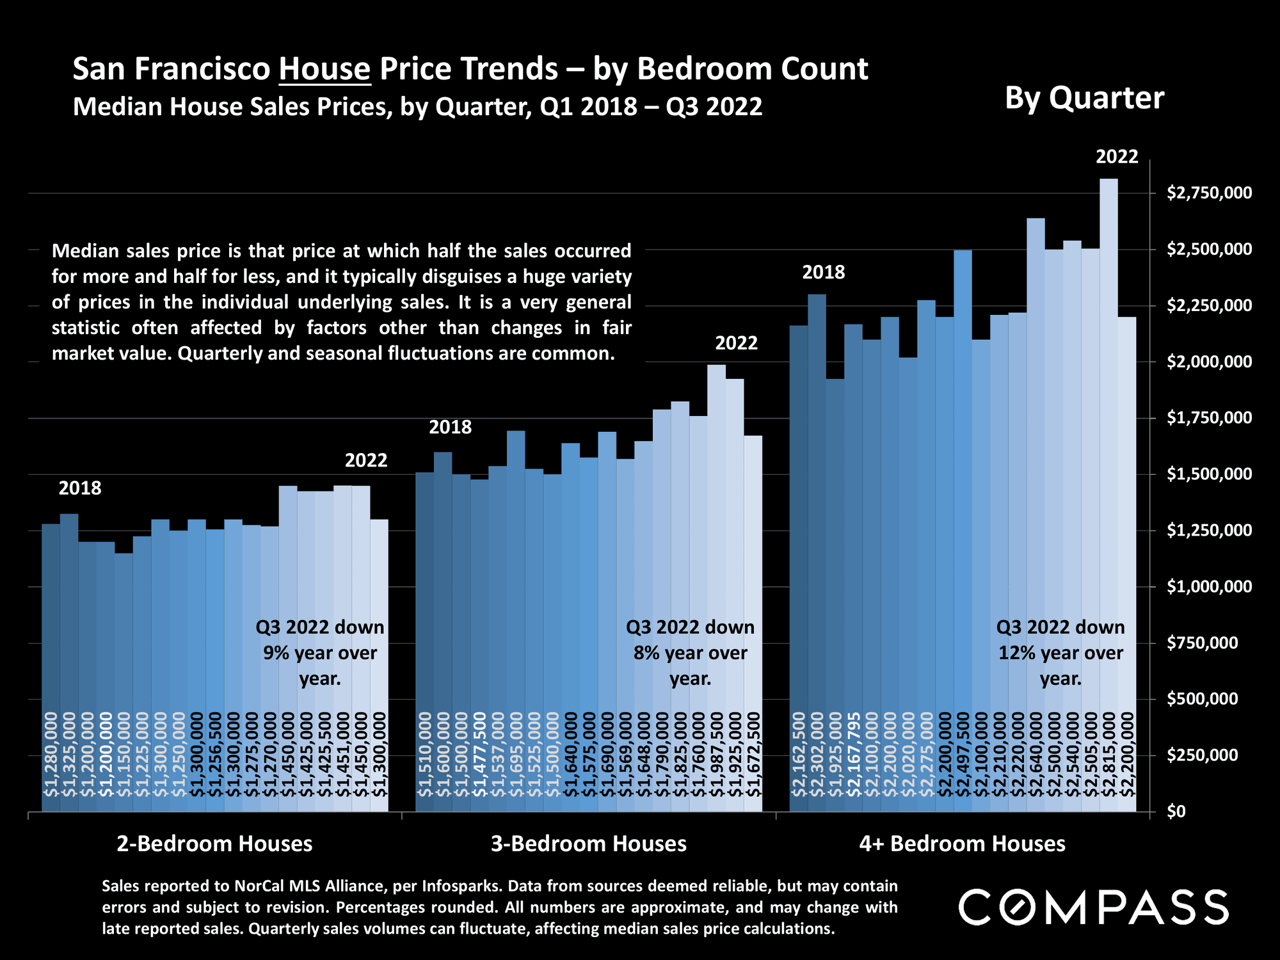
Chart of San Francisco house prices by bedroom count, showing Q3 2022 year-over-year declines across all categories.
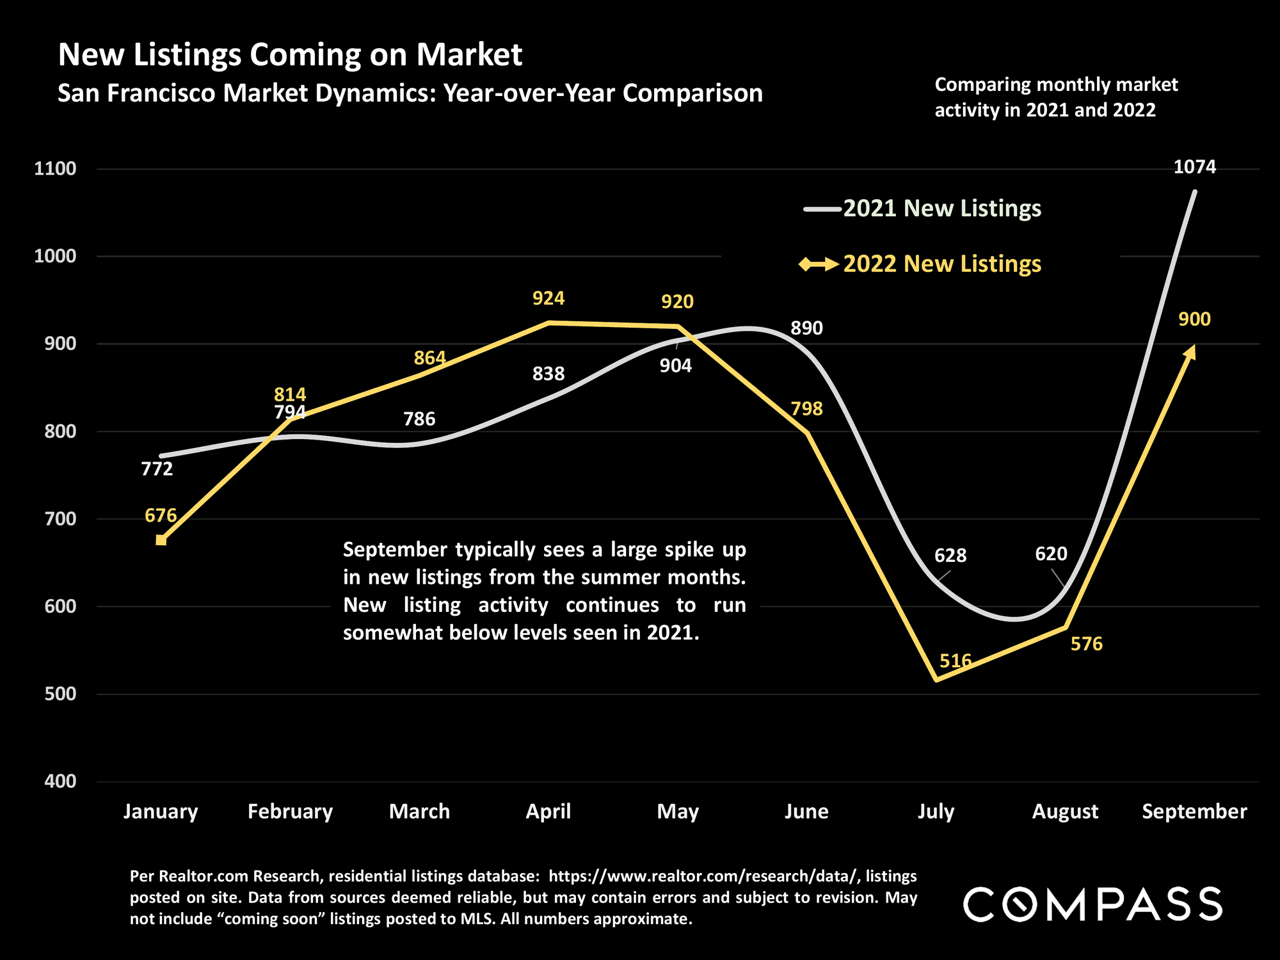
Chart comparing monthly San Francisco new listings in 2021 and 2022, January through September.
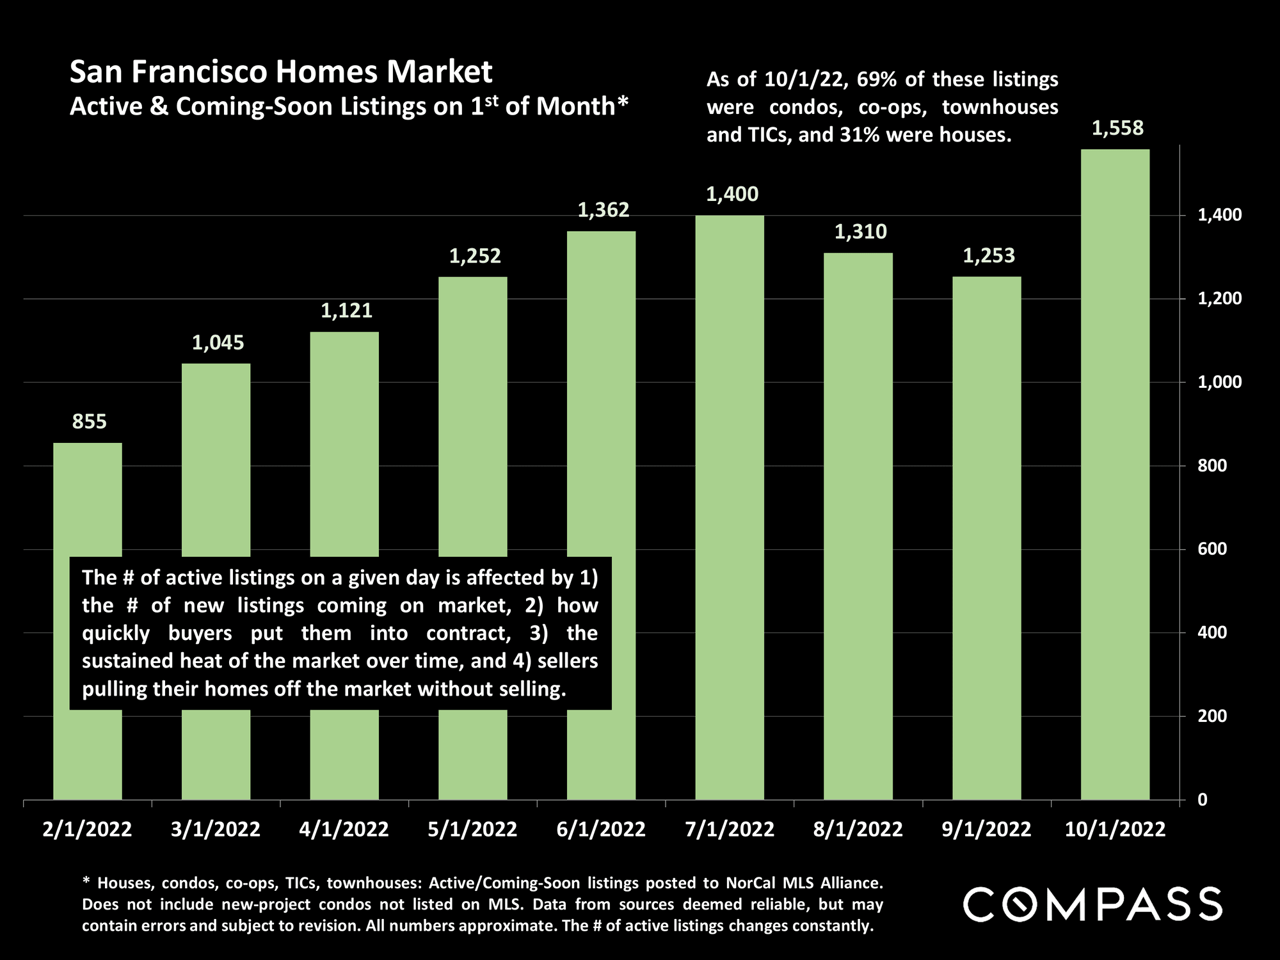
Bar chart of San Francisco active and coming-soon listings, rising to 1,558 in October 2022.
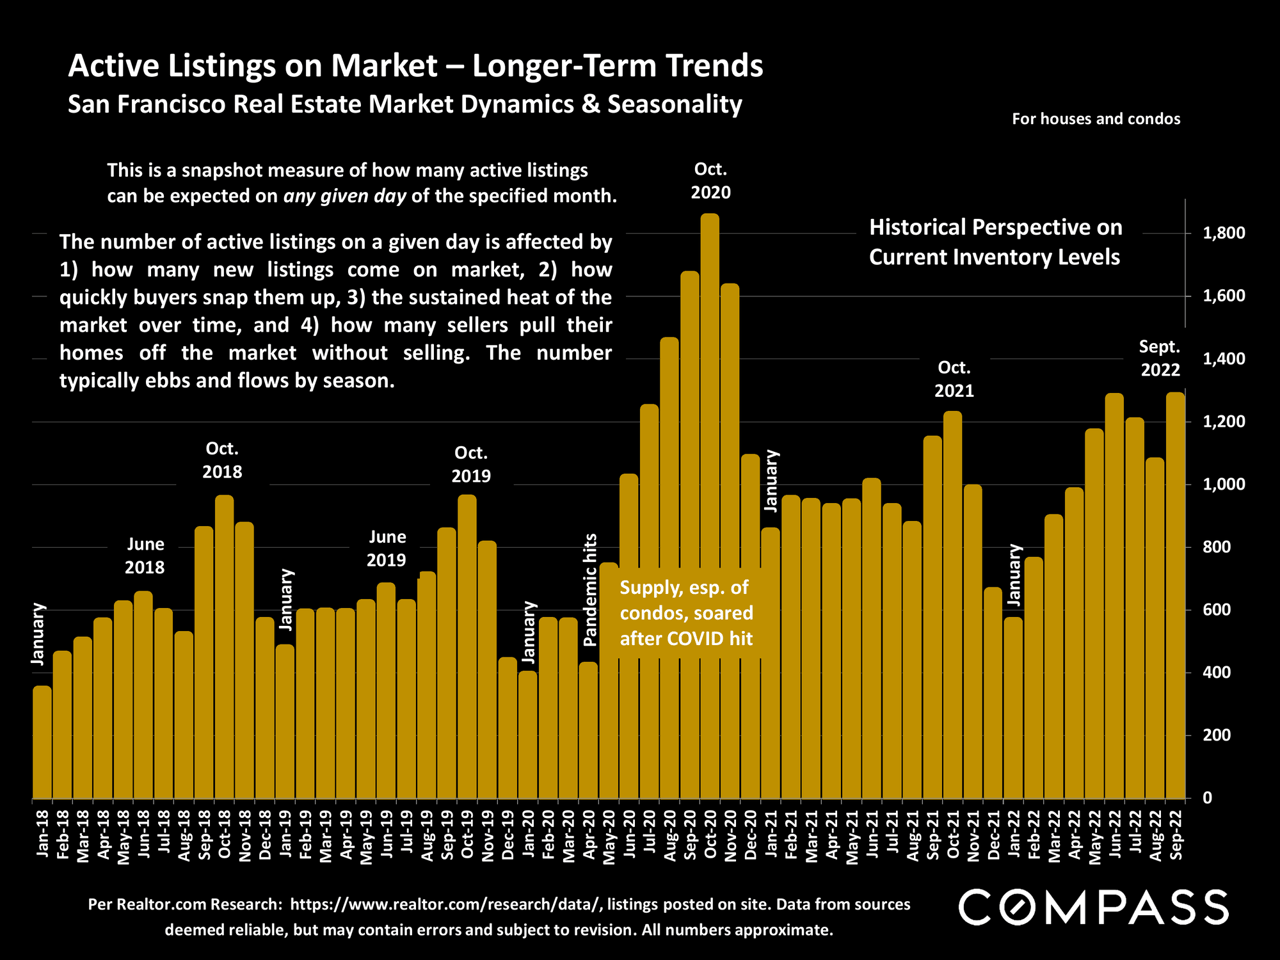
Bar chart of San Francisco active listings, January 2018–September 2022, with a 2020 peak and 2022 inventory trend.
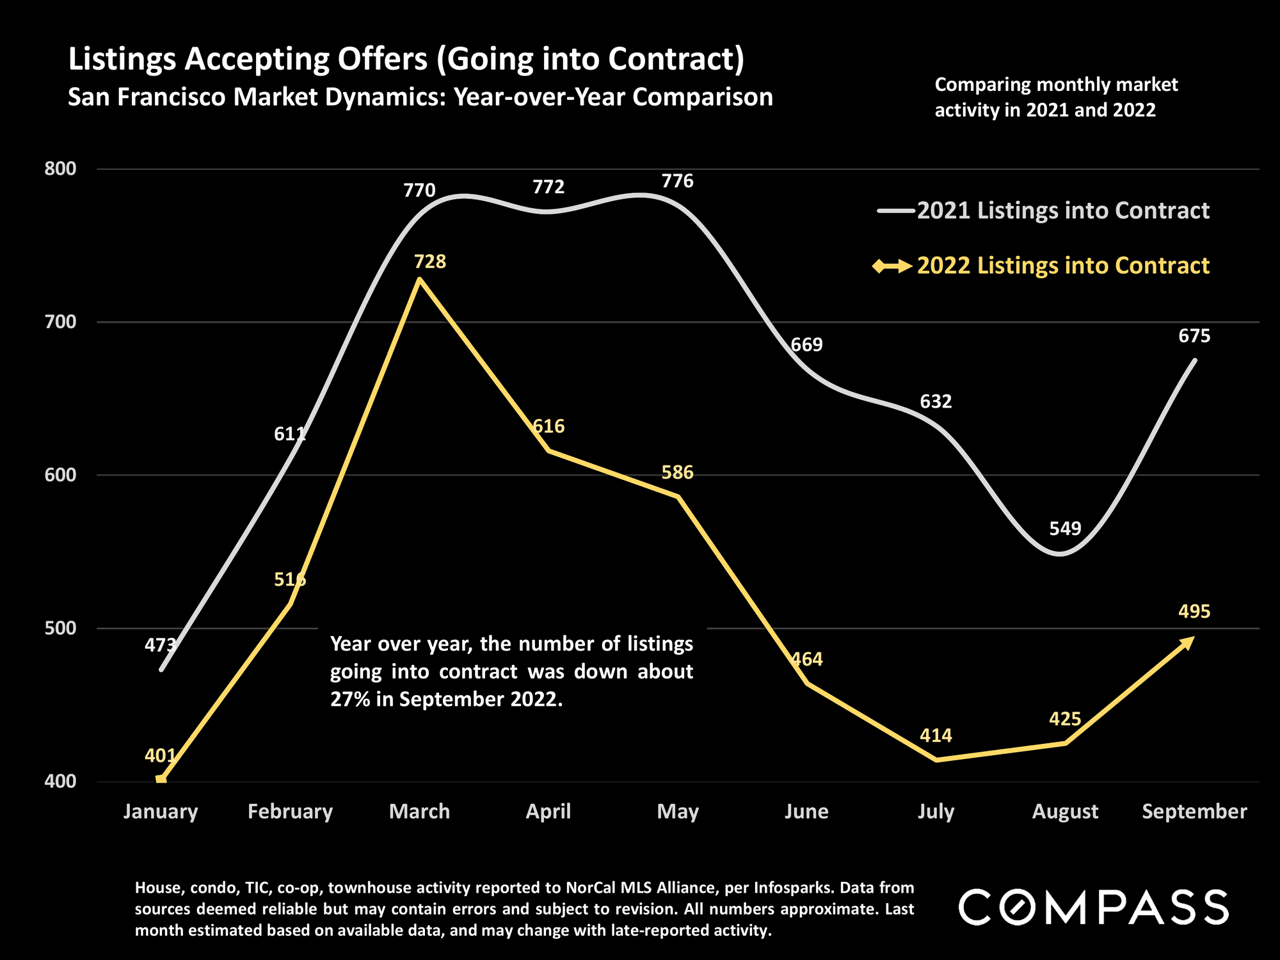
San Francisco chart comparing monthly listings going into contract in 2021 and 2022, with 2022 down 27% in September.
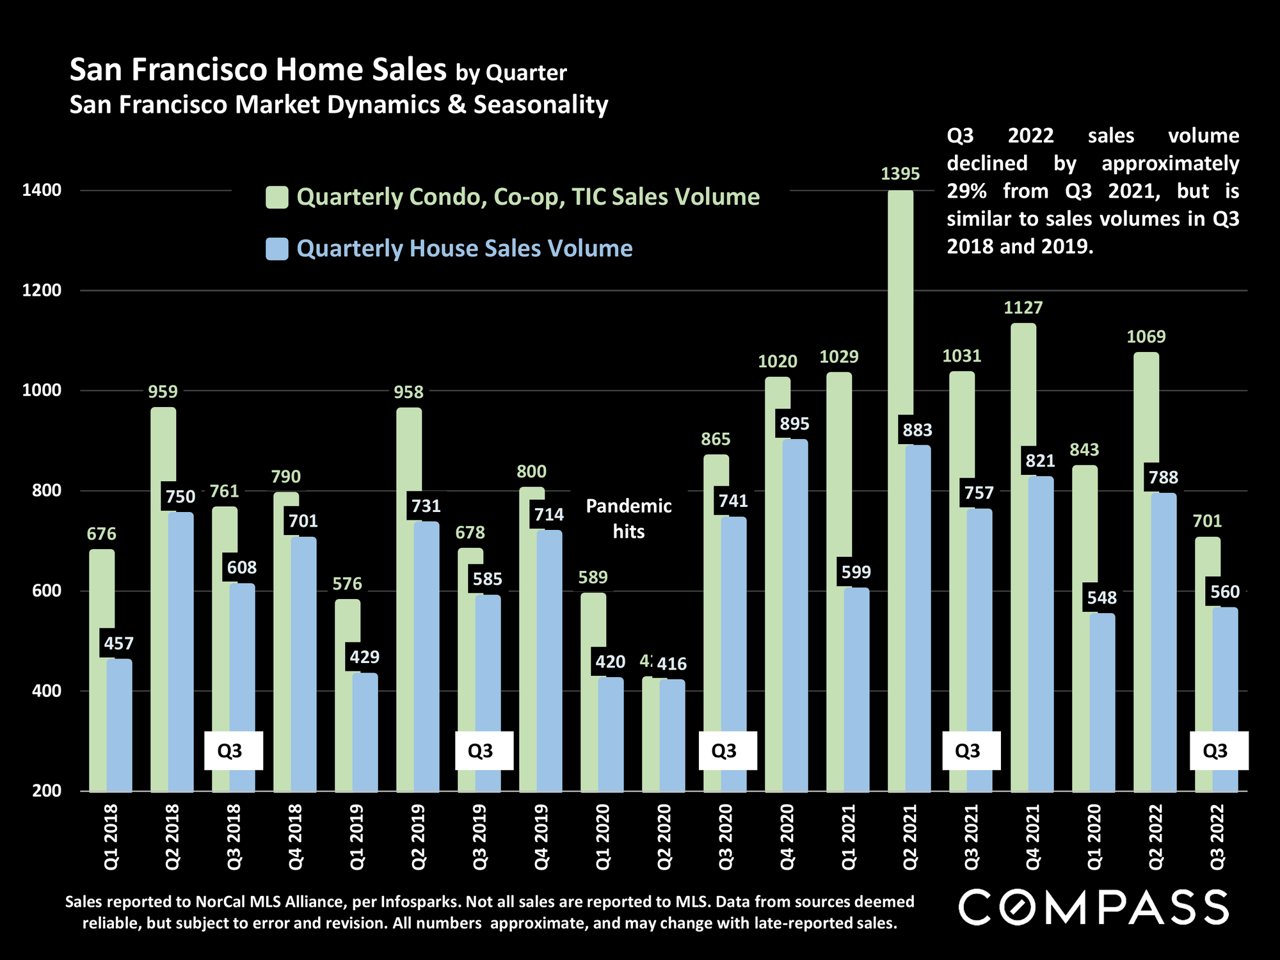
Chart compares quarterly San Francisco condo and house sales volumes from 2018 through Q3 2022.
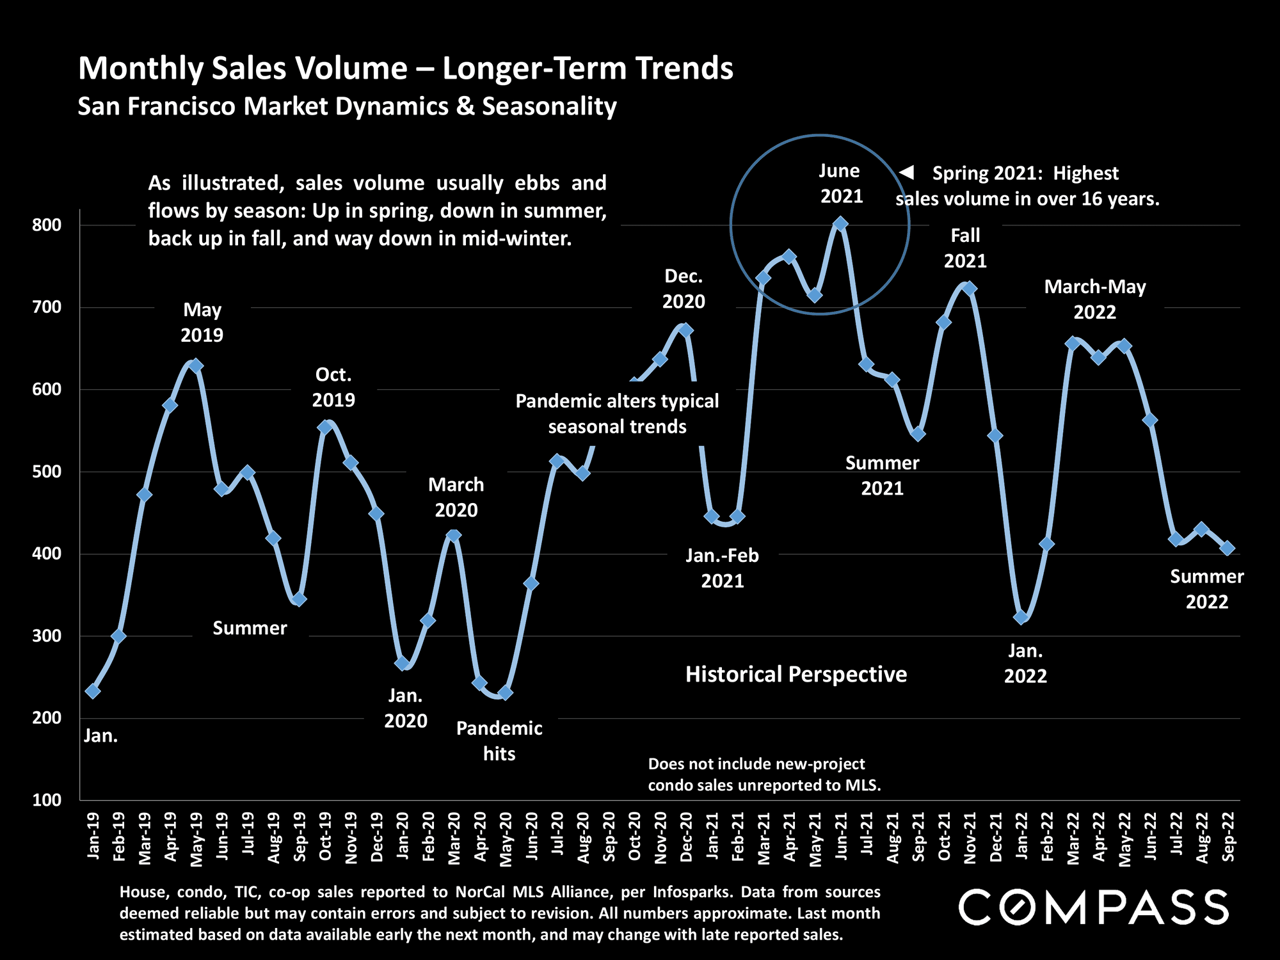
San Francisco monthly home sales chart, January 2019–September 2022, showing seasonal trends and a spring 2021 peak.
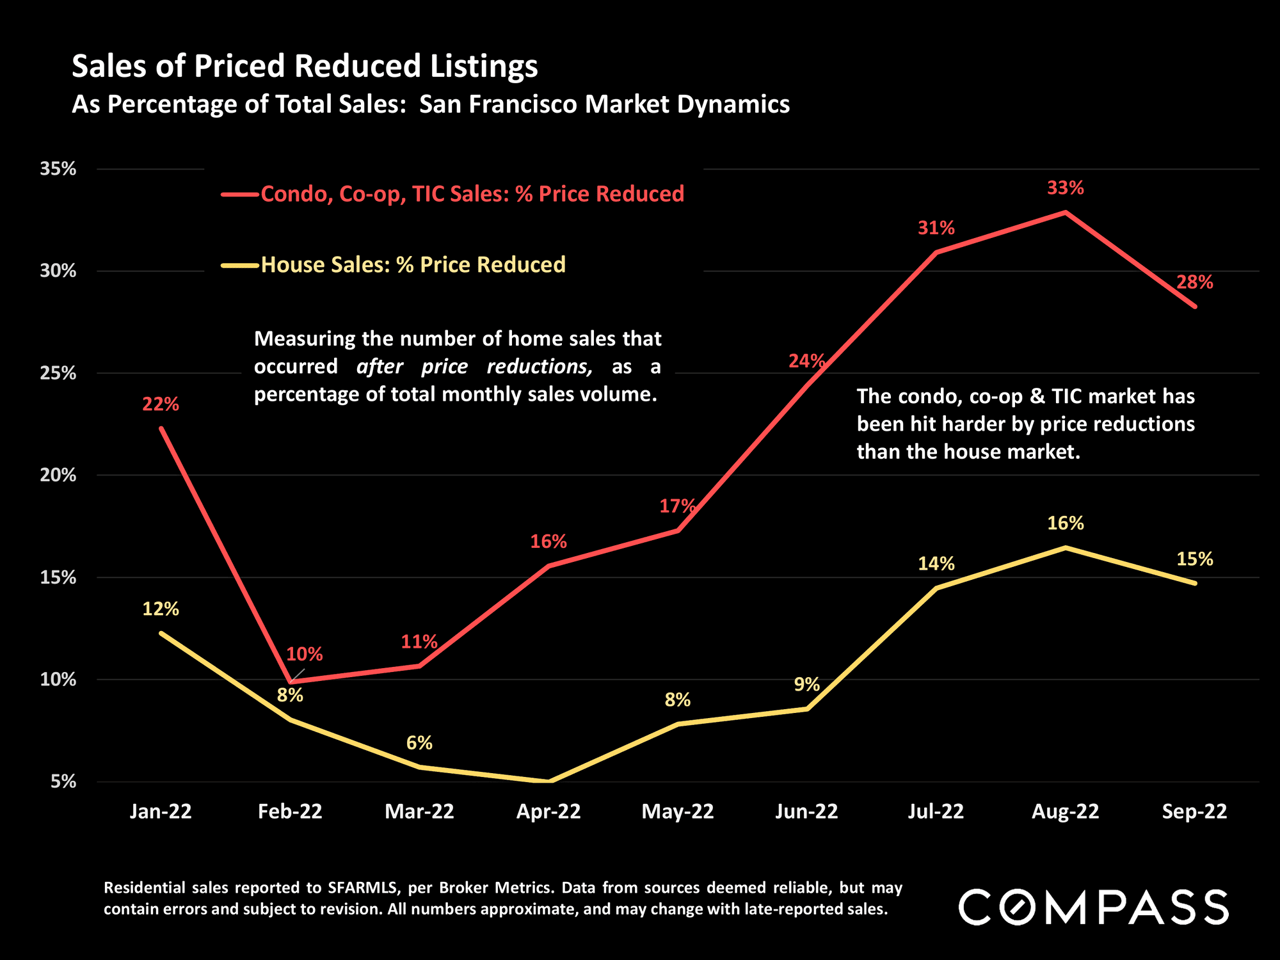
Line chart comparing price-reduced San Francisco condo and house sales from January to September 2022.
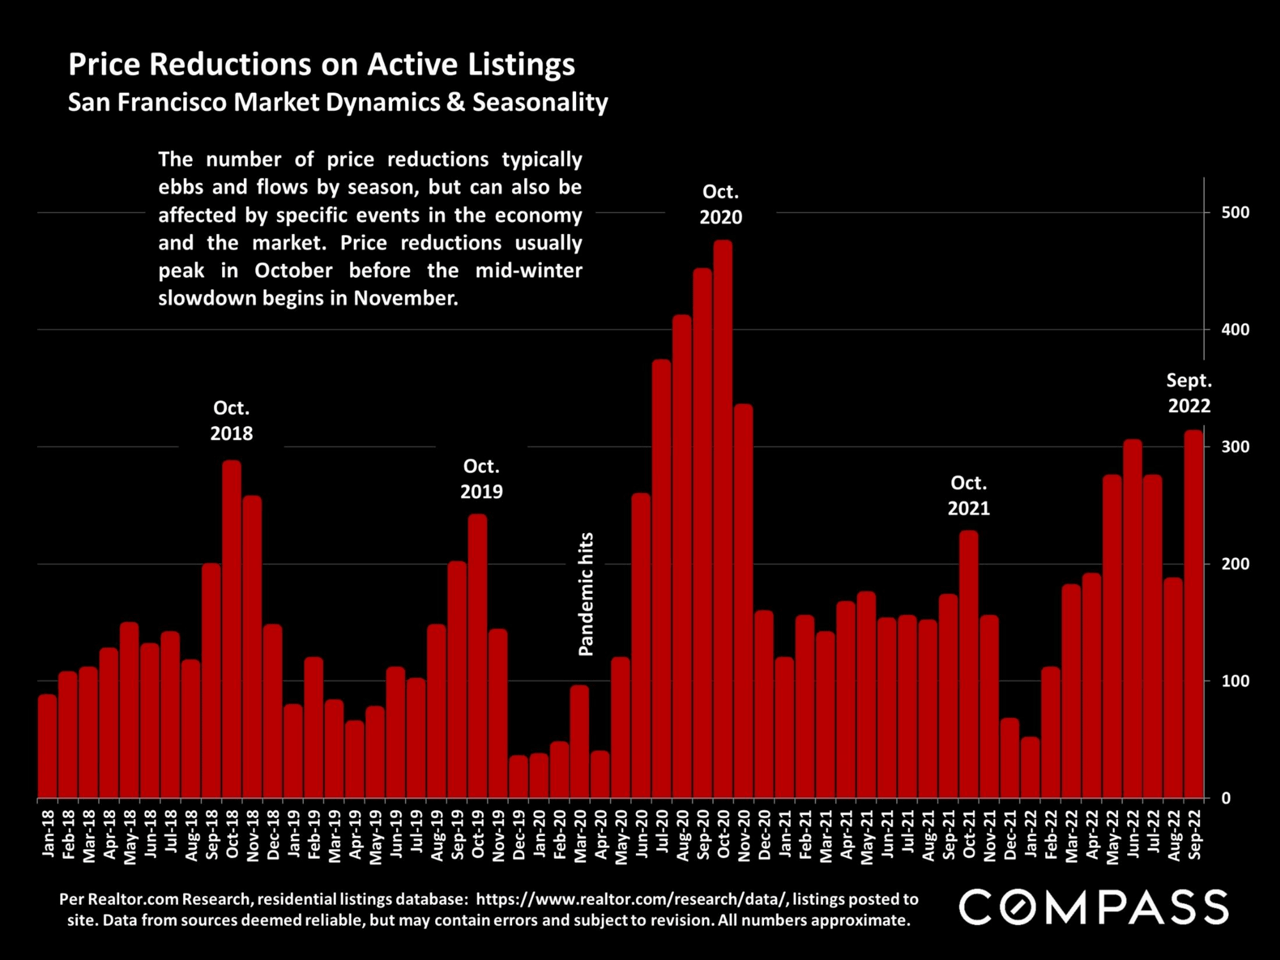
Bar chart of San Francisco active-listing price reductions, with October peaks from 2018 to 2021 and a 2022 rise.
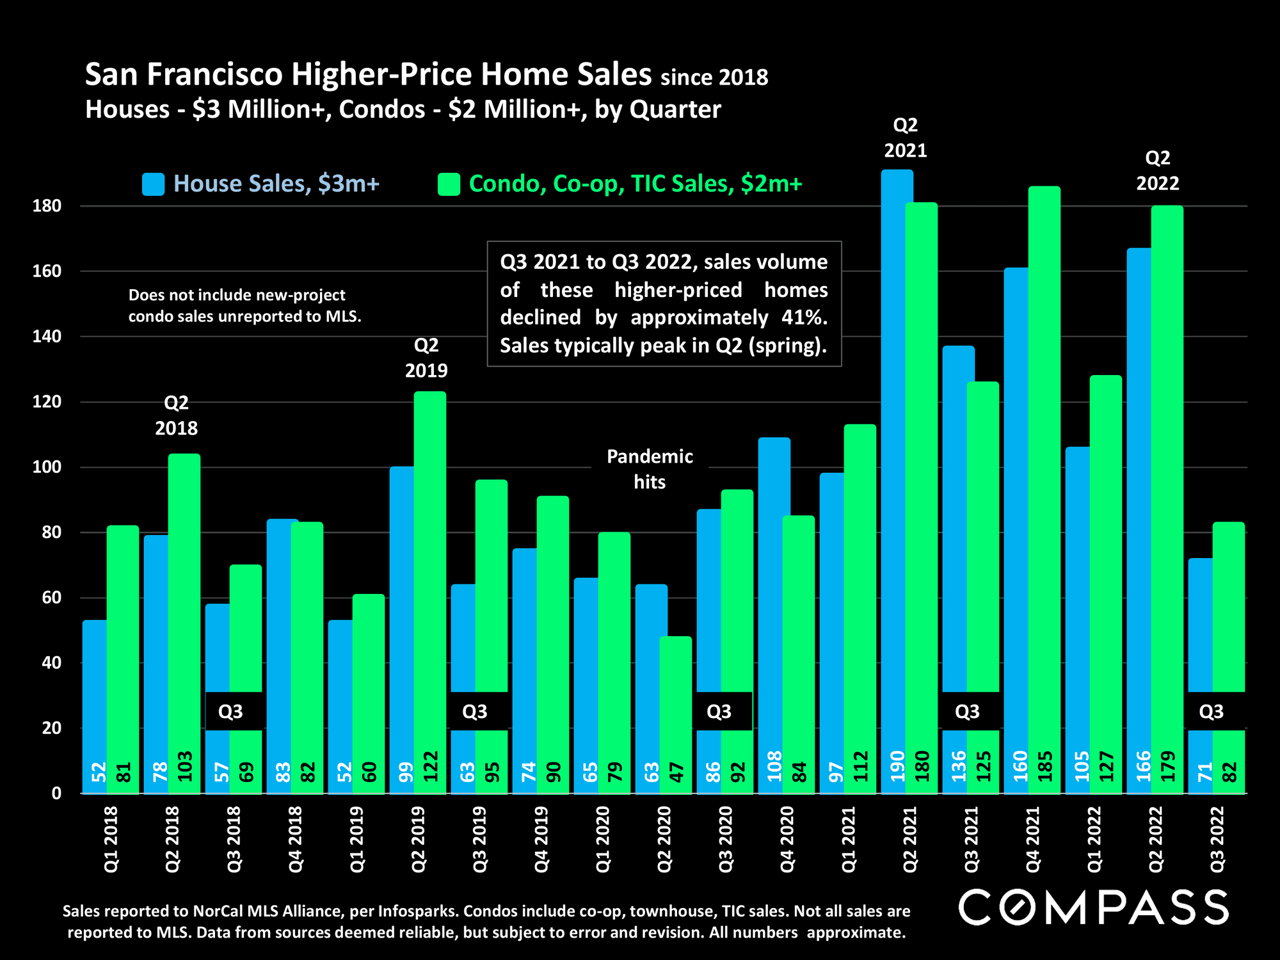
Chart comparing quarterly San Francisco sales of $3 million-plus houses and $2 million-plus condos from 2018 to 2022.
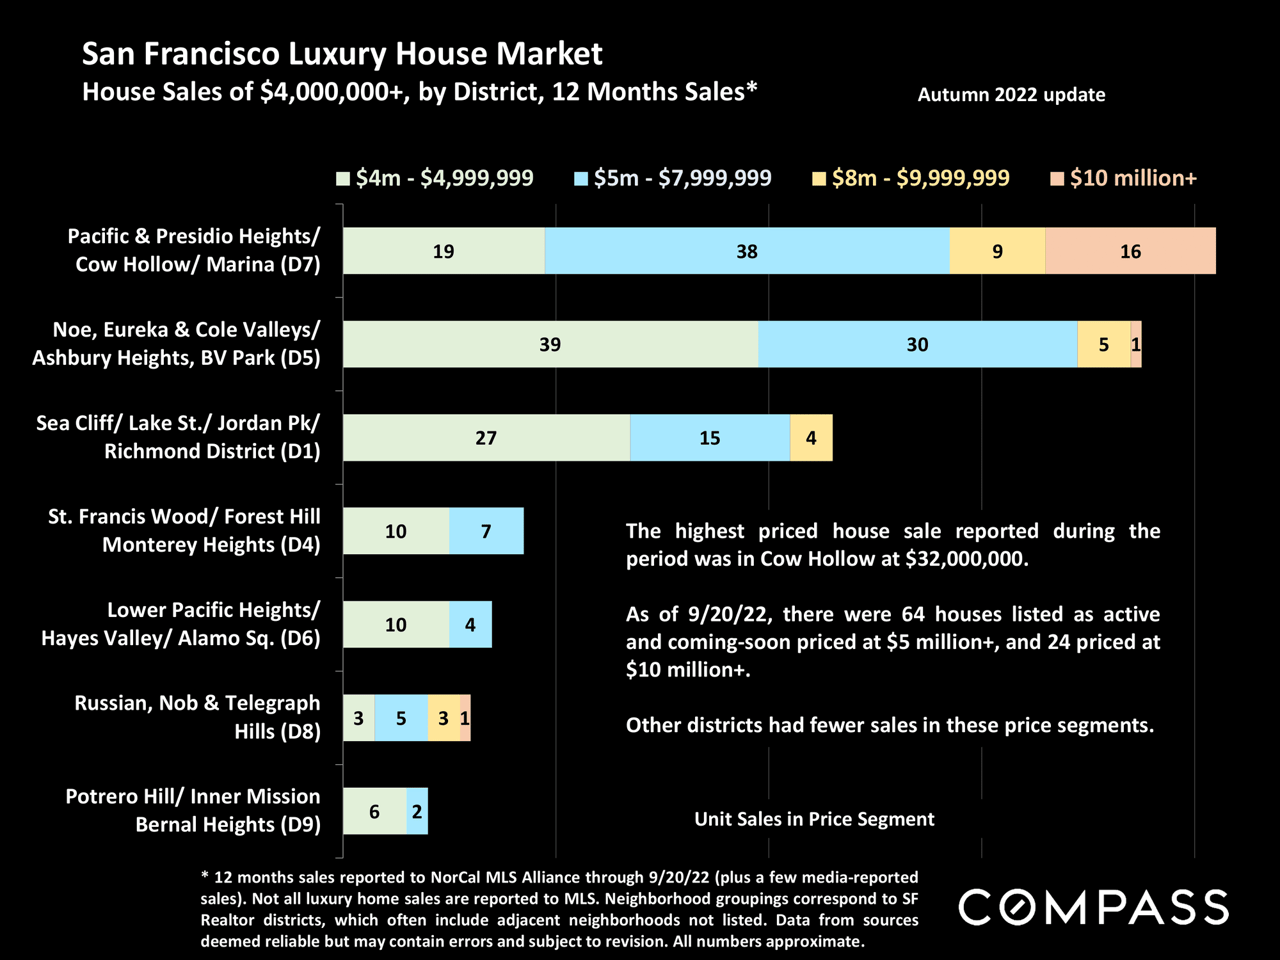
Chart of San Francisco luxury home sales by district and price range, with Cow Hollow leading $10 million-plus sales.
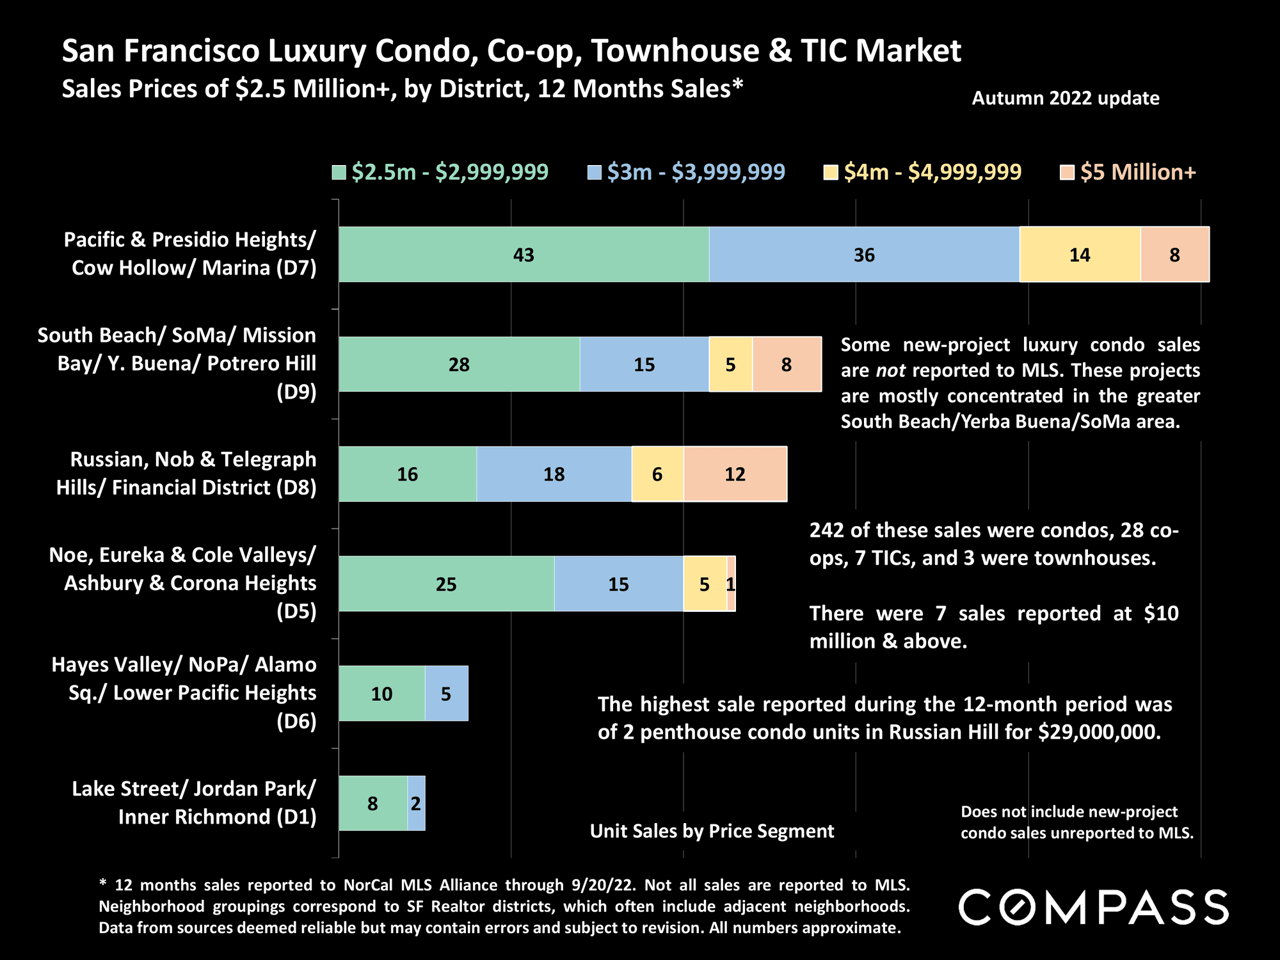
San Francisco luxury home sales chart by district and price range, with the largest total in Pacific Heights and nearby neighborhoods.
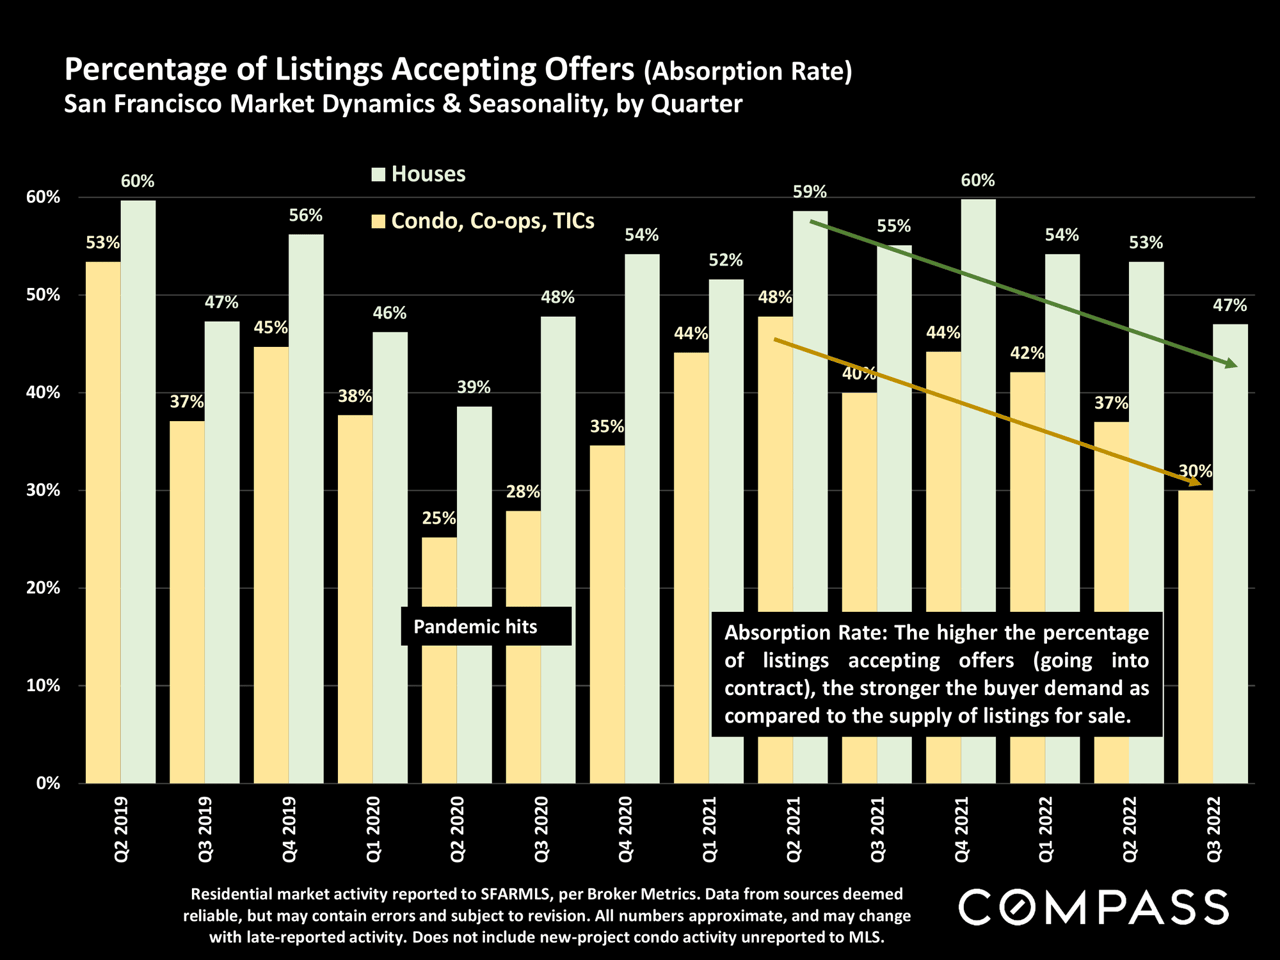
San Francisco quarterly absorption-rate chart: house listings outperform condos, co-ops, and TICs from 2019 to 2022.
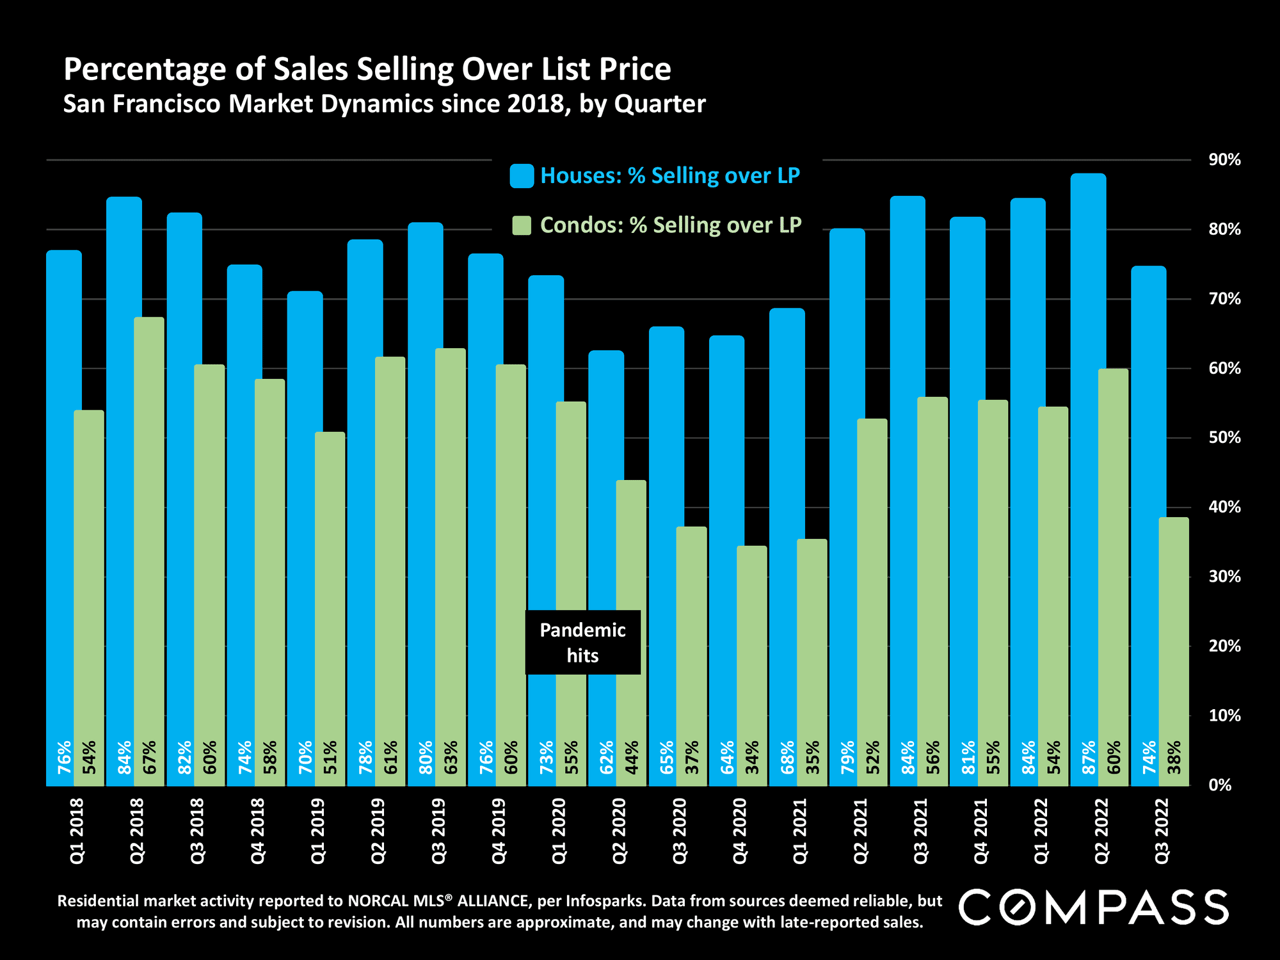
Chart comparing San Francisco house and condo sales above list price by quarter, 2018–2022, with a pandemic marker.
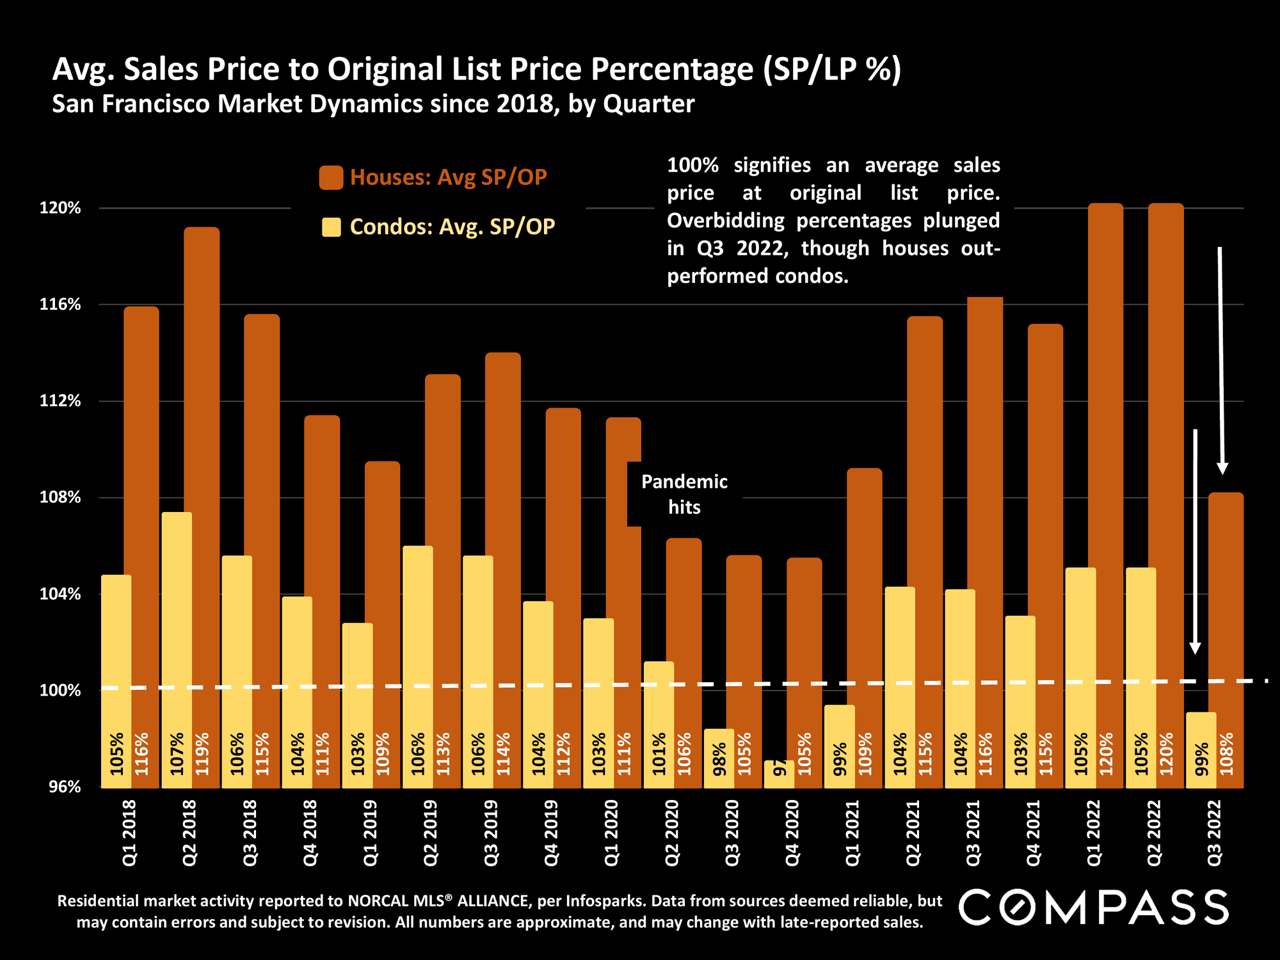
San Francisco quarterly house and condo sale-to-list price percentages, showing a sharp decline in Q3 2022.
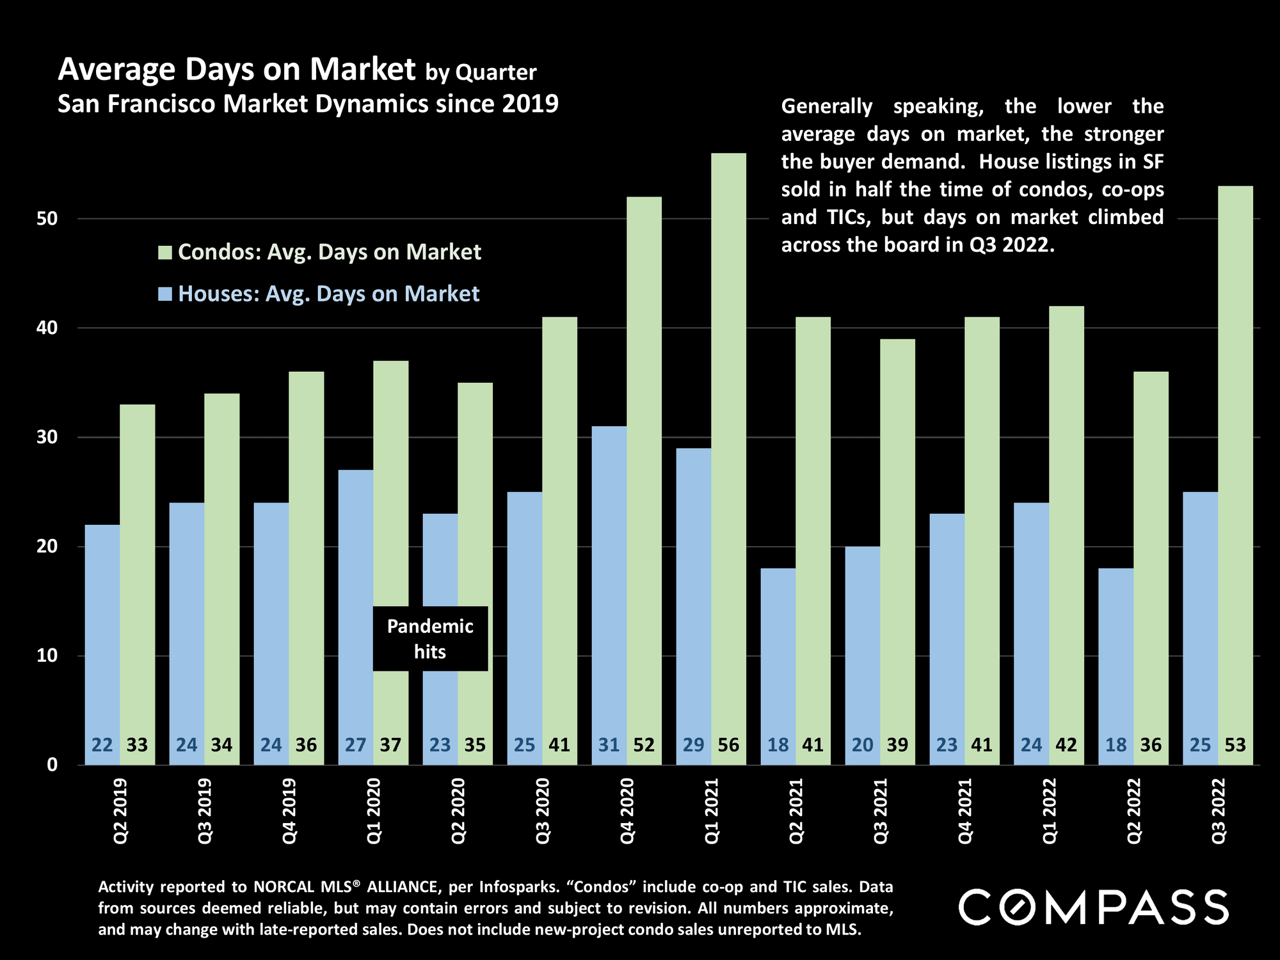
San Francisco chart compares quarterly average days on market for condos and houses, 2019–2022.
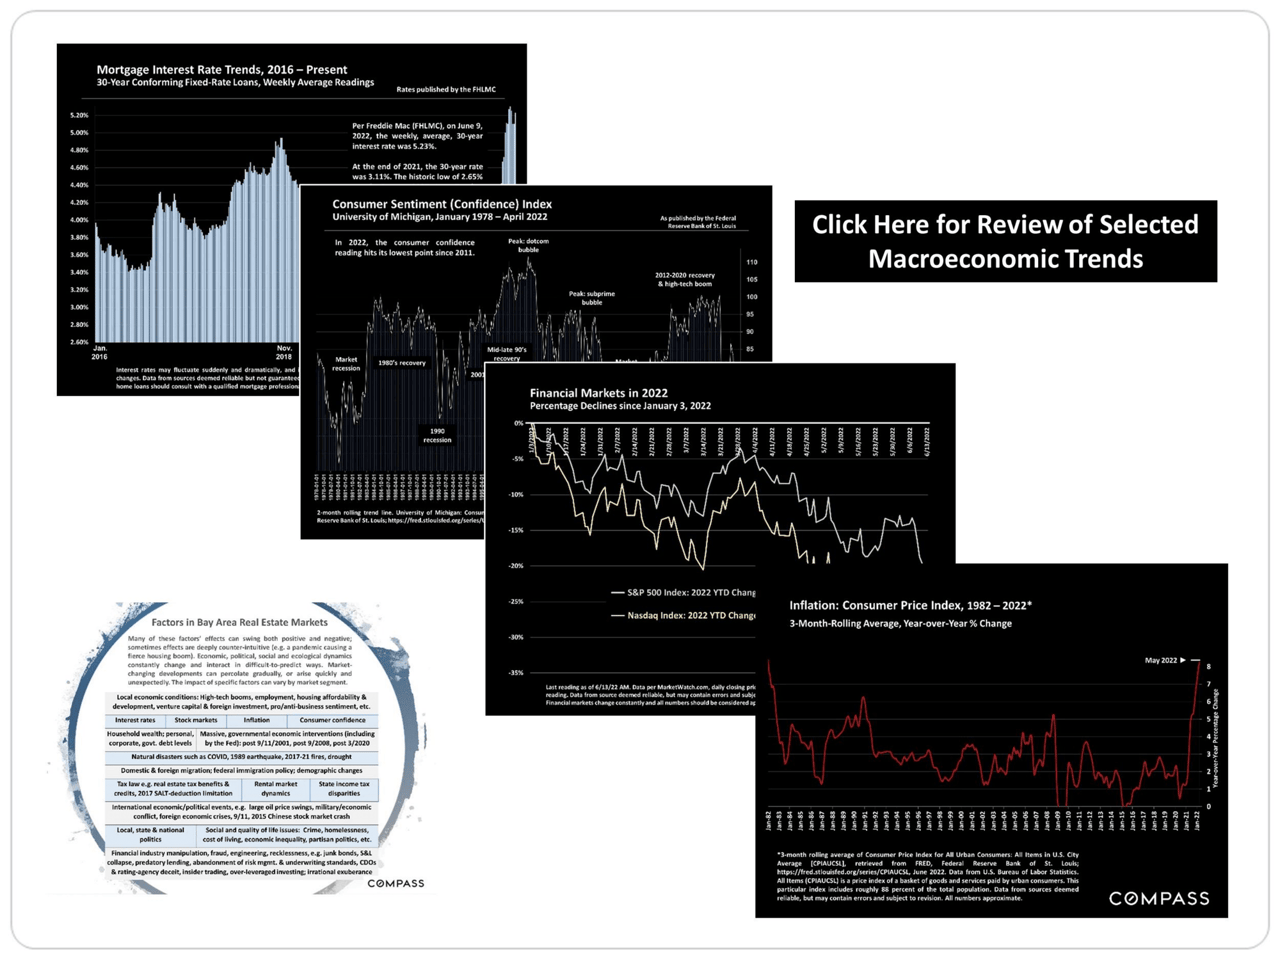
Market report graphic with charts on interest rates, consumer sentiment, financial markets, inflation, and Bay Area real estate.
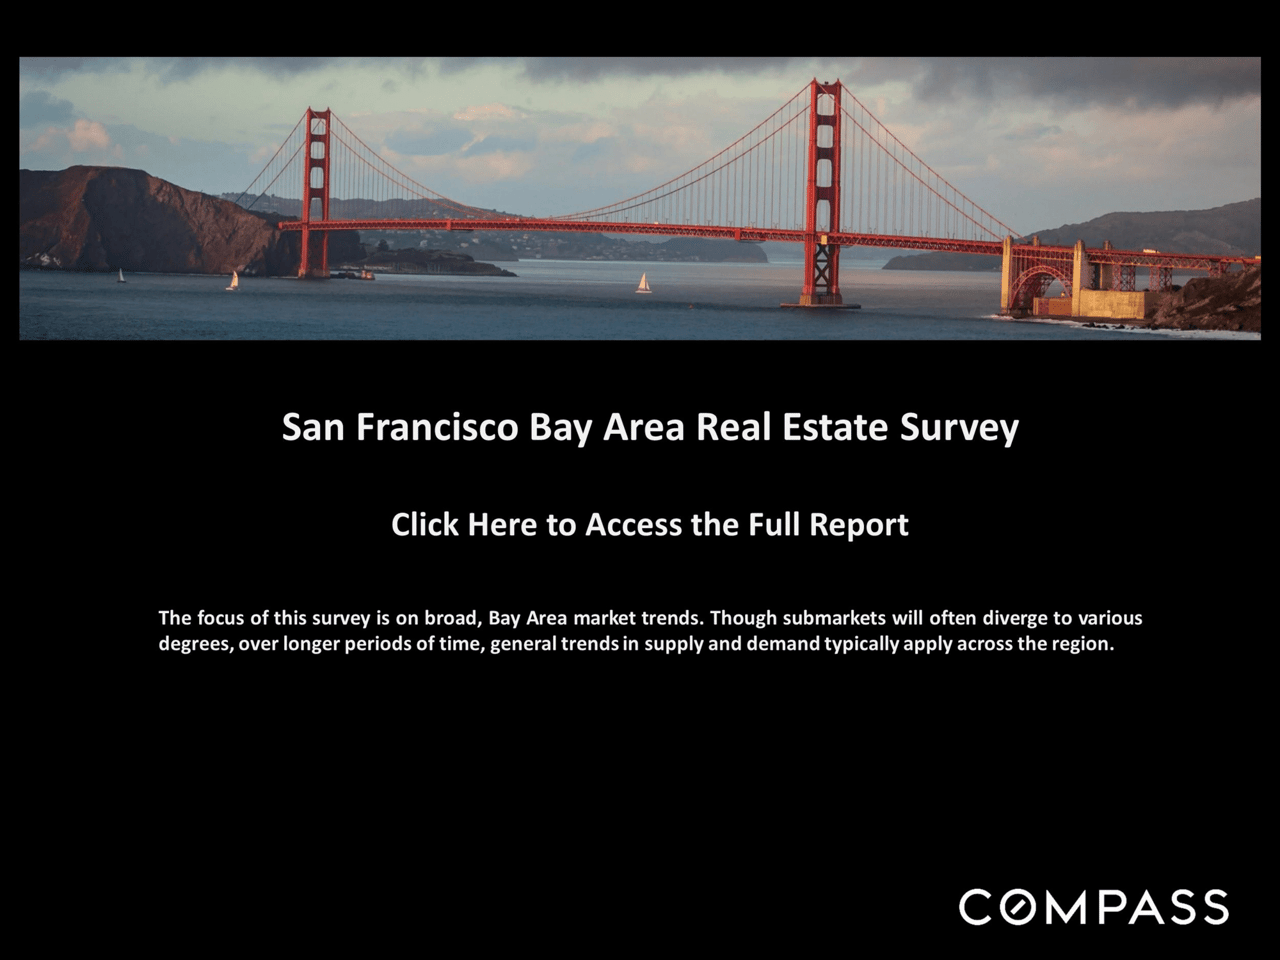
San Francisco Bay Area real estate survey report with a Golden Gate Bridge panorama and Compass branding.
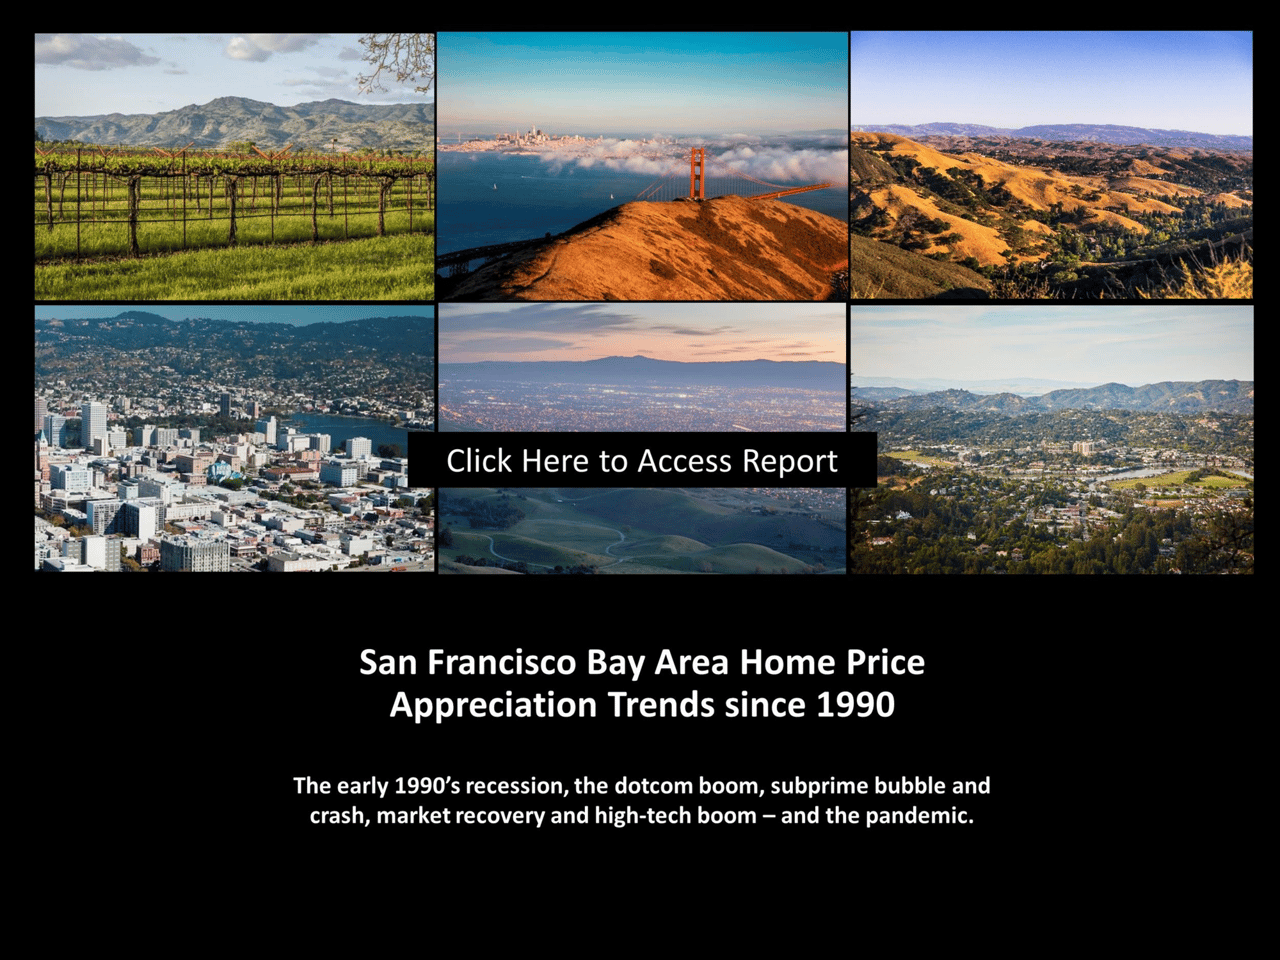
San Francisco Bay Area home price appreciation trends since 1990 report link.
Real estate market report notes on statistics, median sales price, price per square foot, and data disclaimers.
San Francisco Chinatown street with crowded shop signs, traffic, birds, and the Bay Bridge in the distance.

Let’s Work Together

I love people and connecting with new opportunities. Let's talk about what's next for you, wherever you call home.