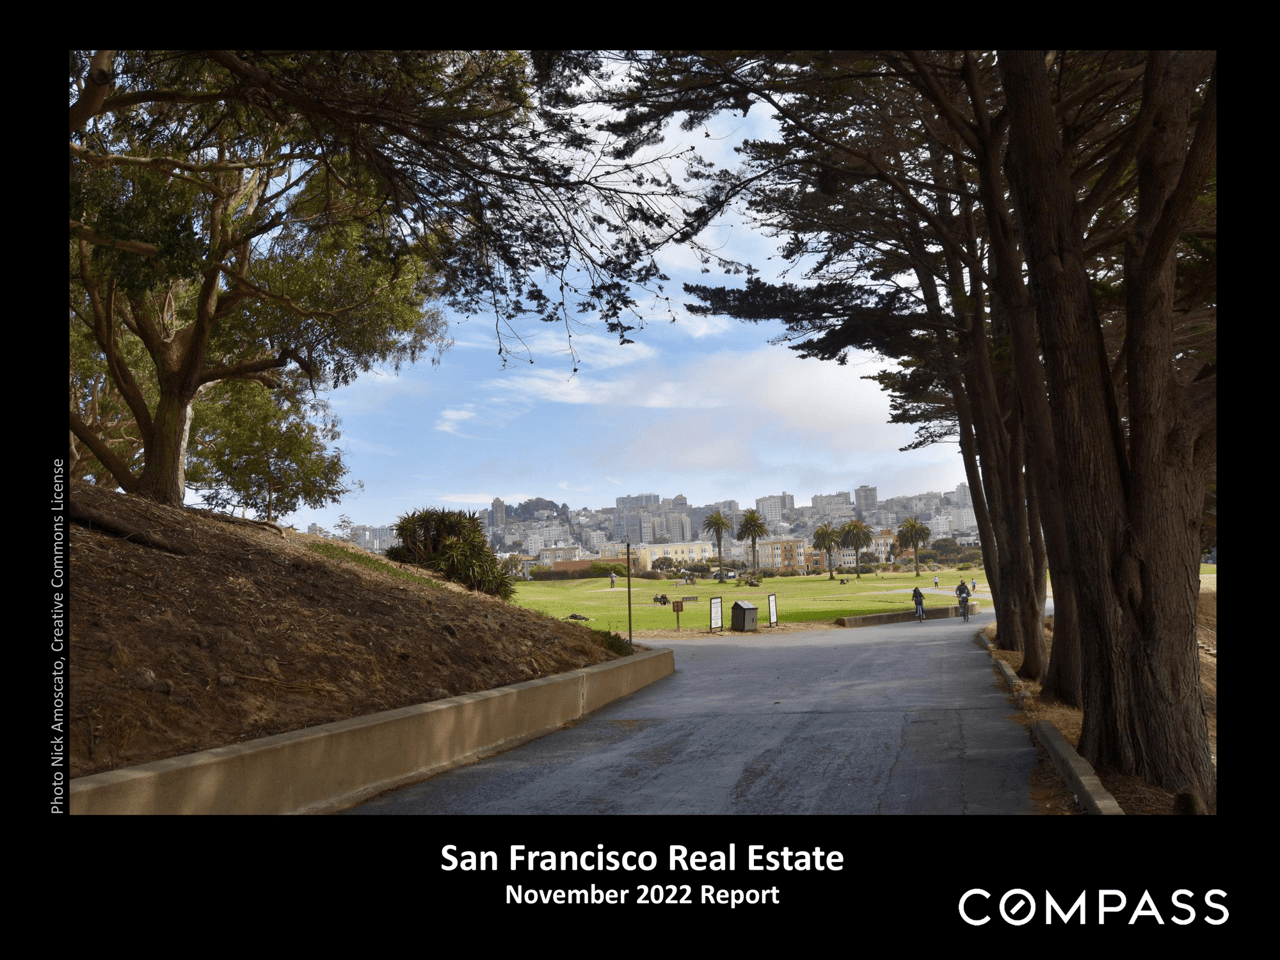
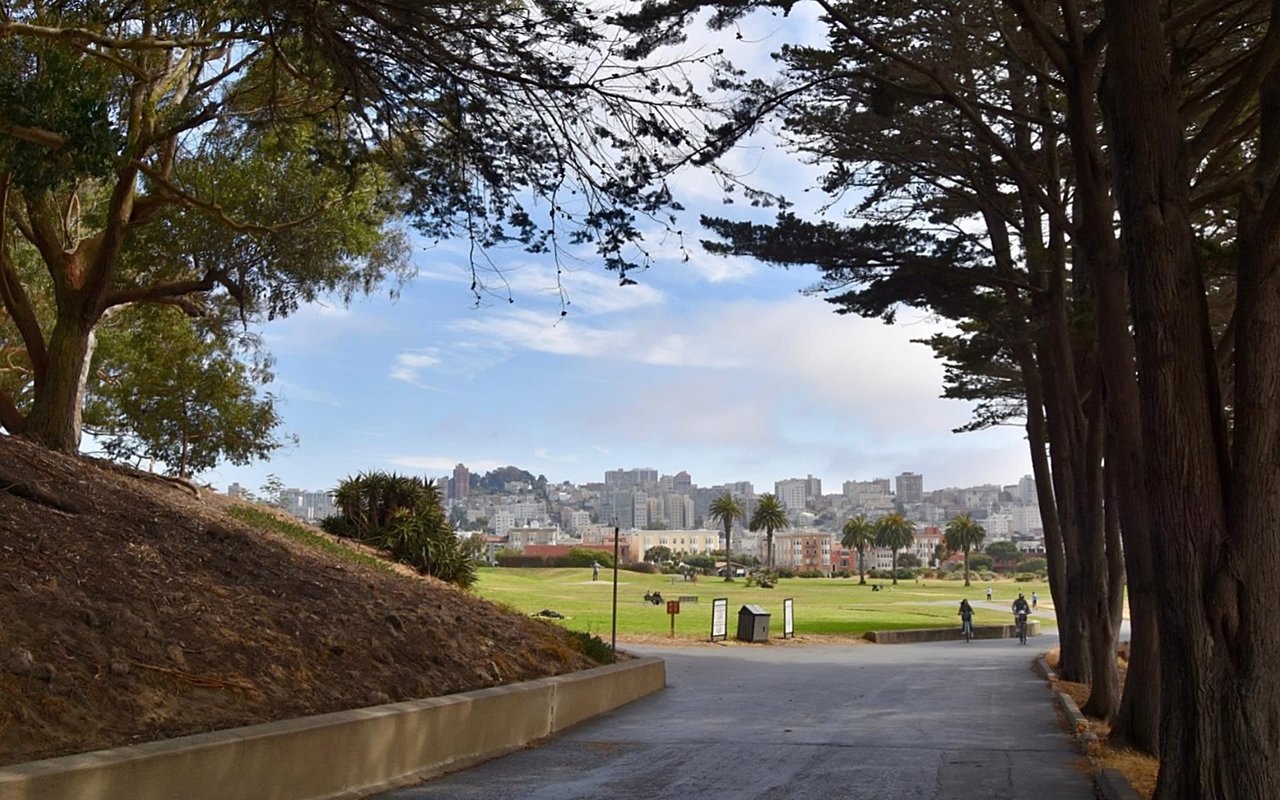
November 2022 San Francisco real estate report cover with a tree-framed park and city skyline.
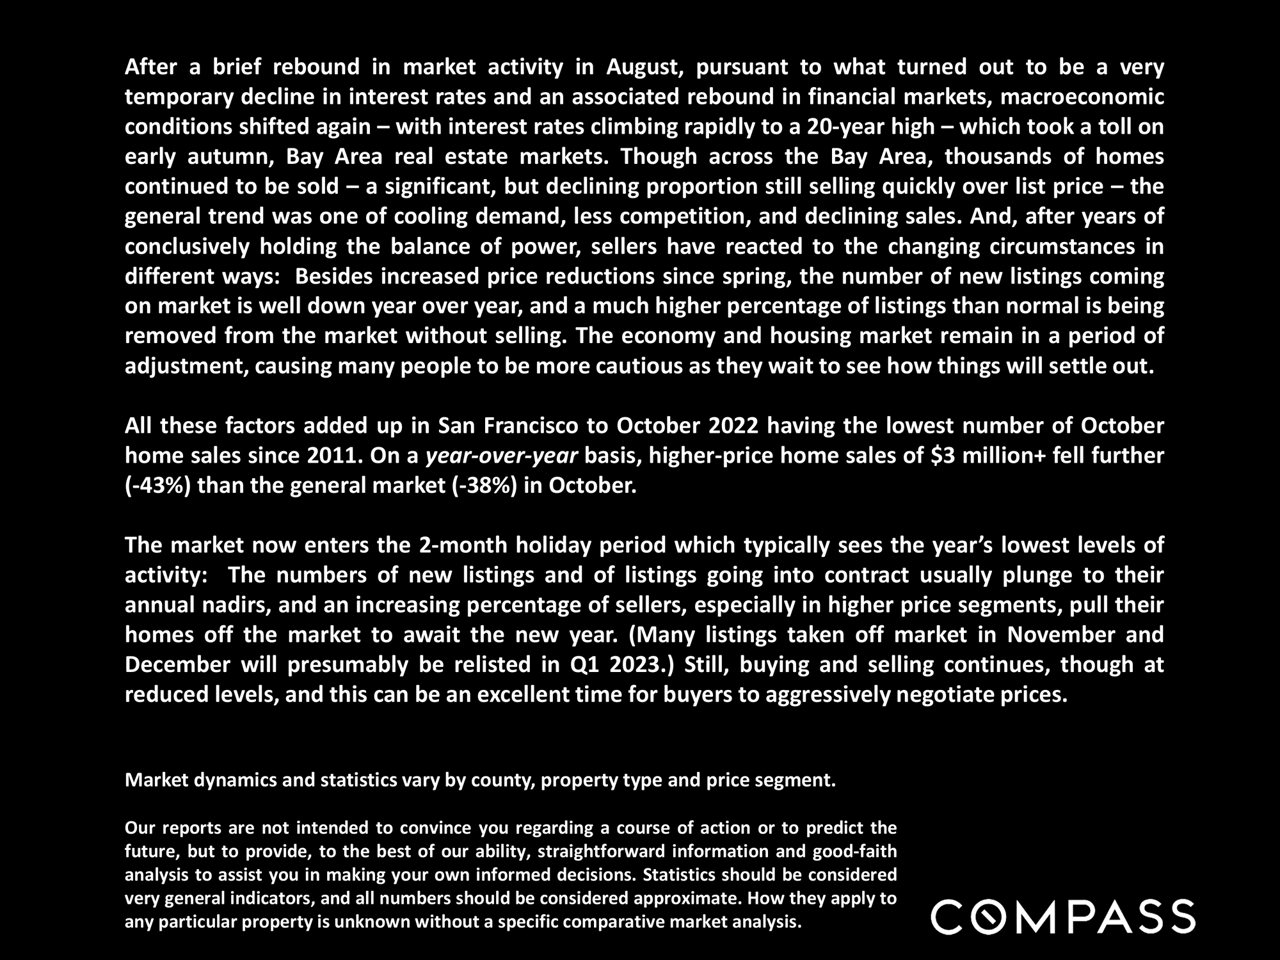
November 2022 market report summarizing Bay Area housing trends, declining sales, and the seasonal holiday slowdown.
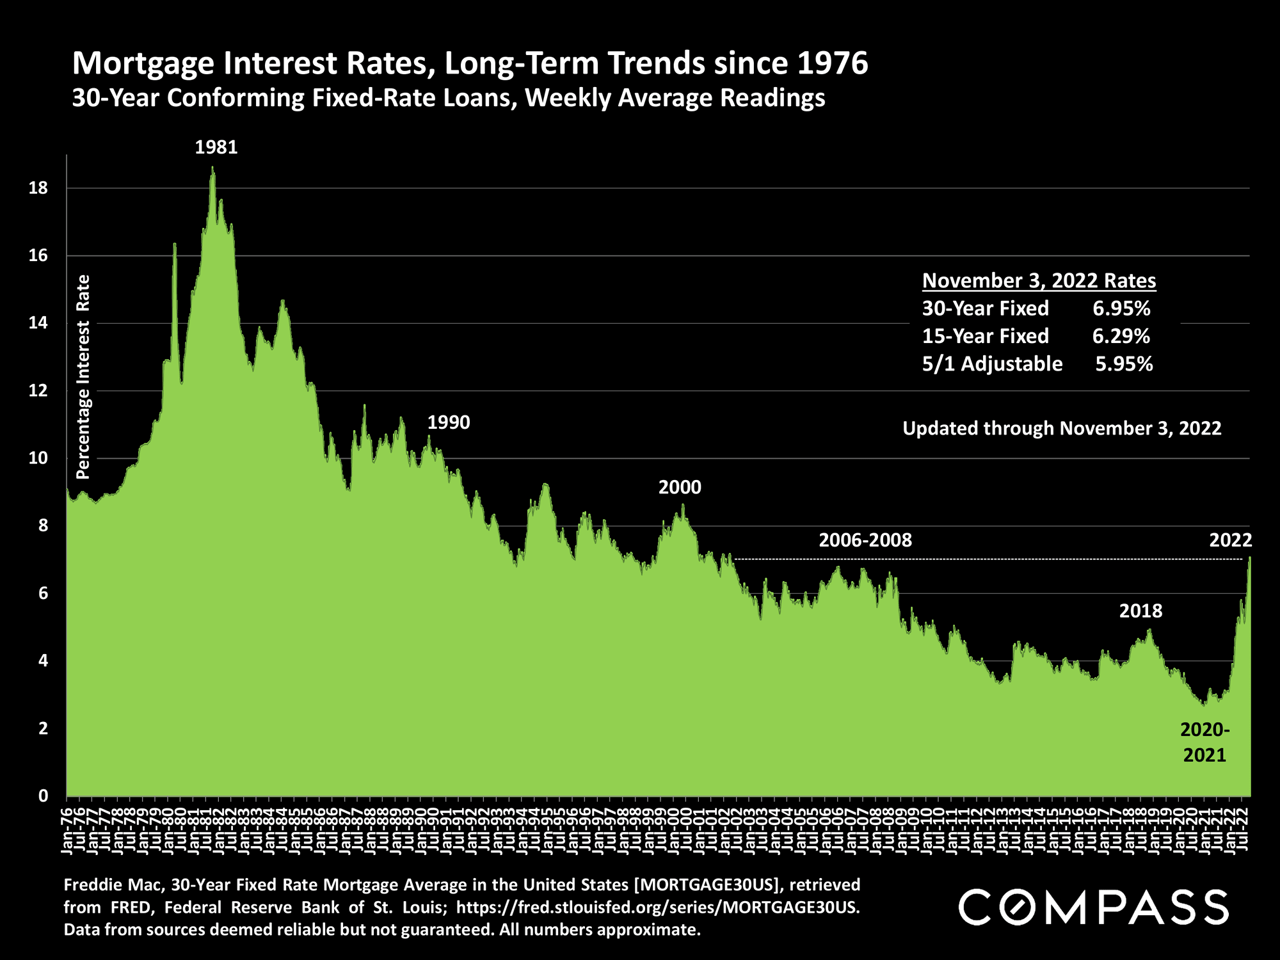
Chart of U.S. mortgage rates from 1976 to 2022, peaking above 18% in 1981 before rising sharply in 2022.
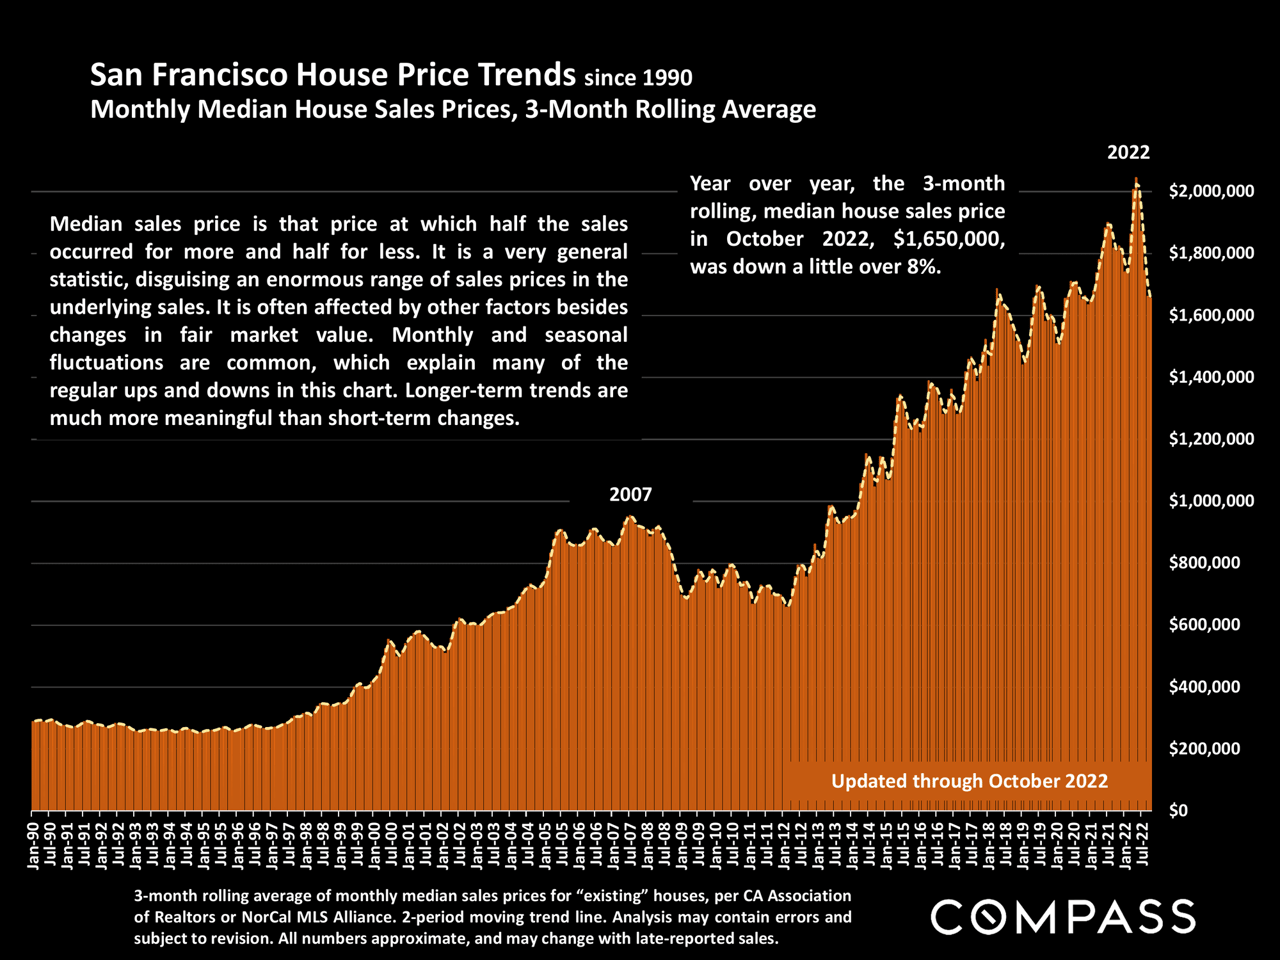
San Francisco house price chart, with orange bars rising to $1.65 million in October 2022.
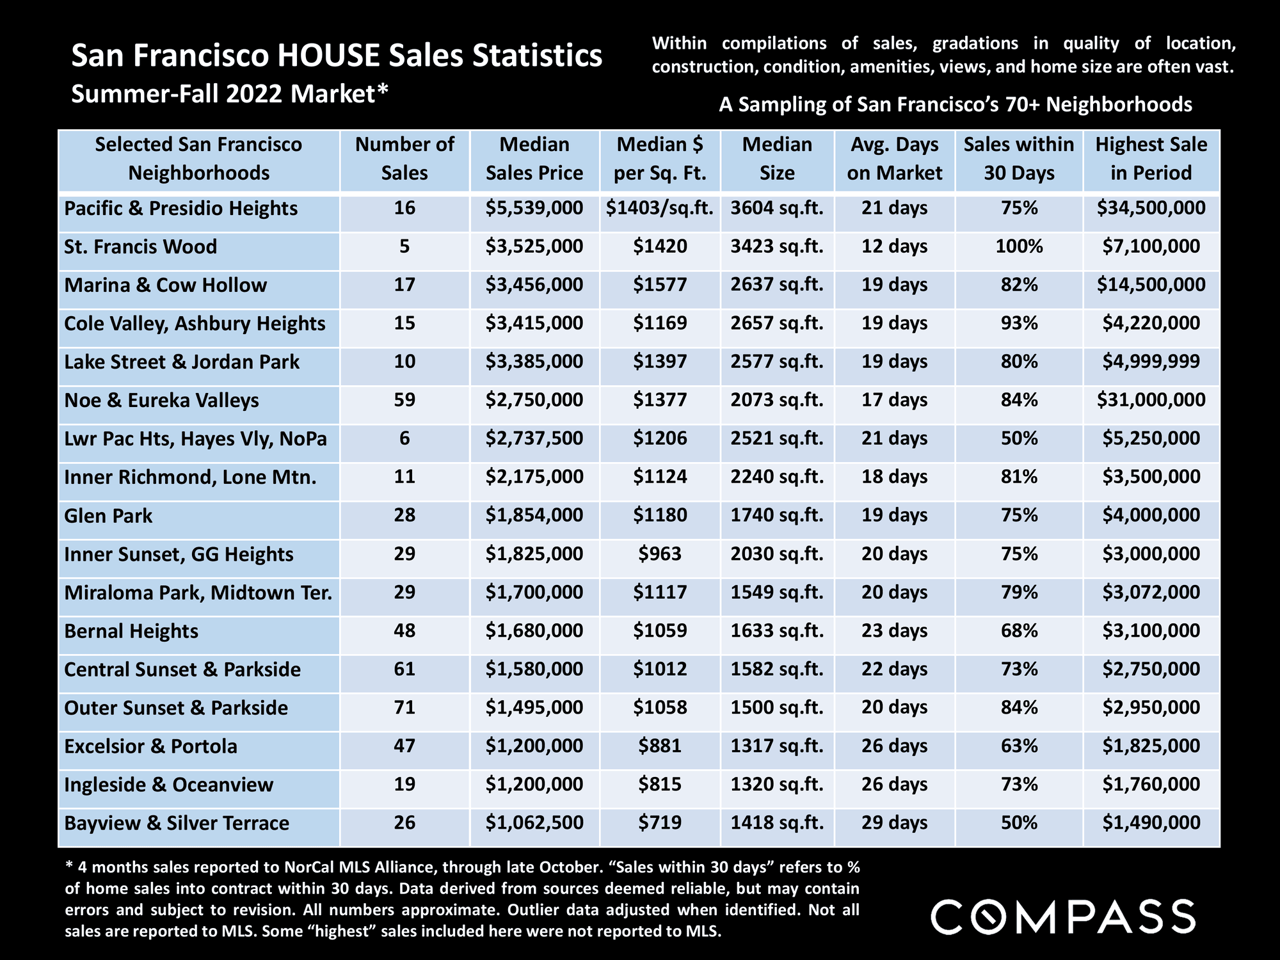
San Francisco home sales statistics by neighborhood for summer–fall 2022.
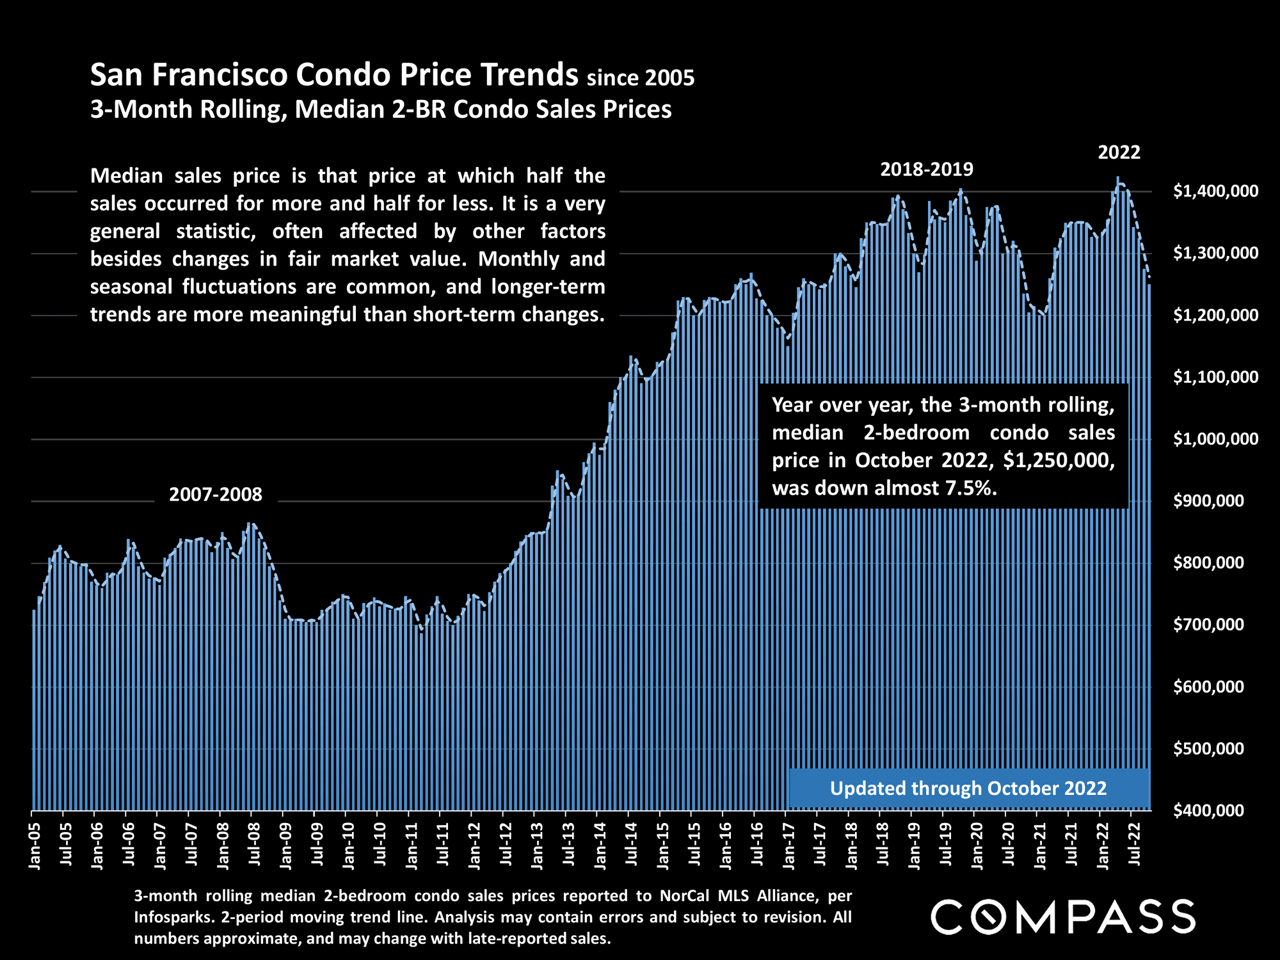
Chart of San Francisco two-bedroom condo prices, peaking near $1.4 million in 2022 before falling.
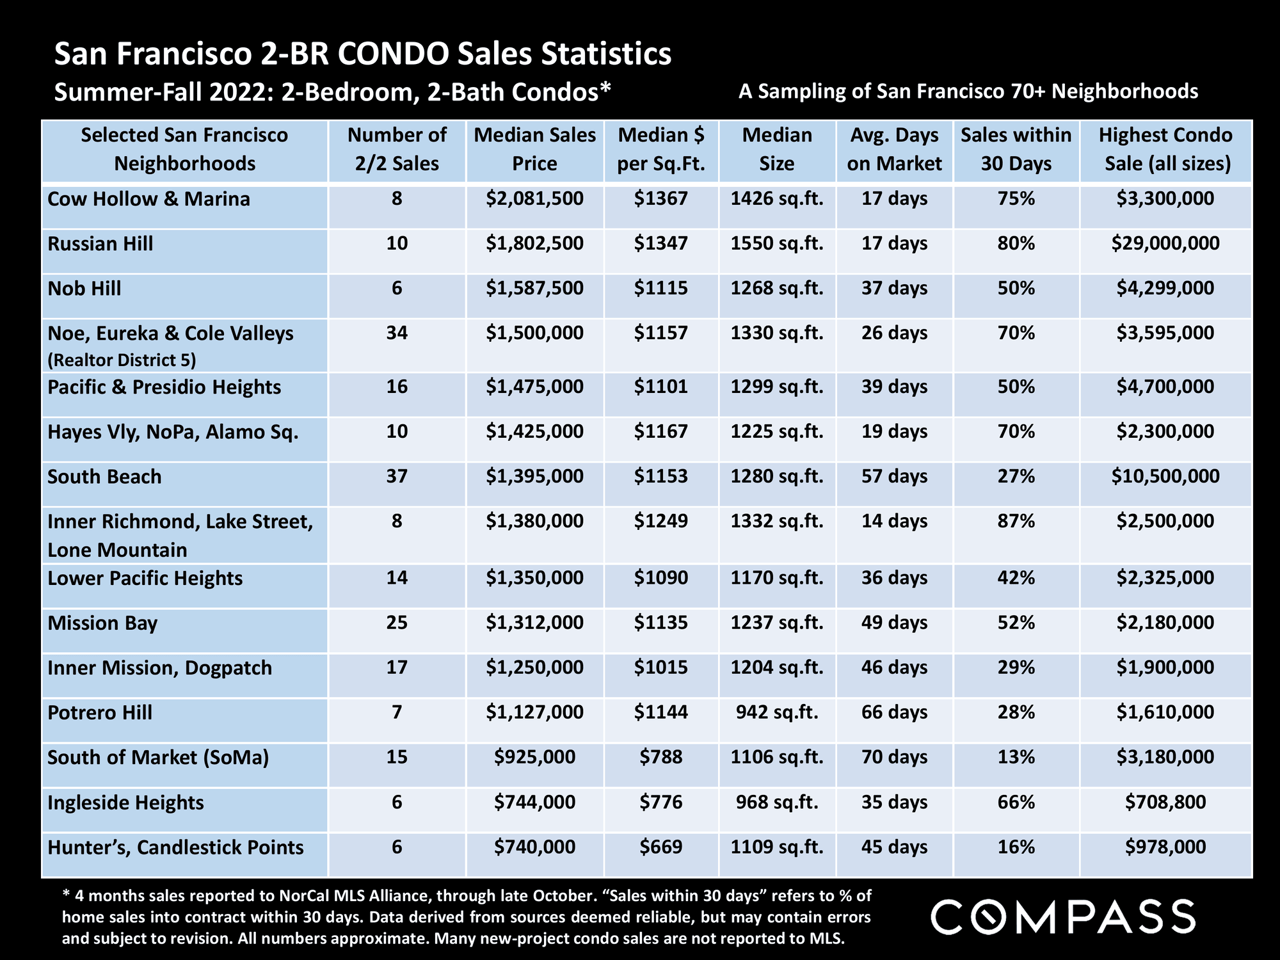
Table comparing two-bedroom condo sales statistics across San Francisco neighborhoods in Summer-Fall 2022.
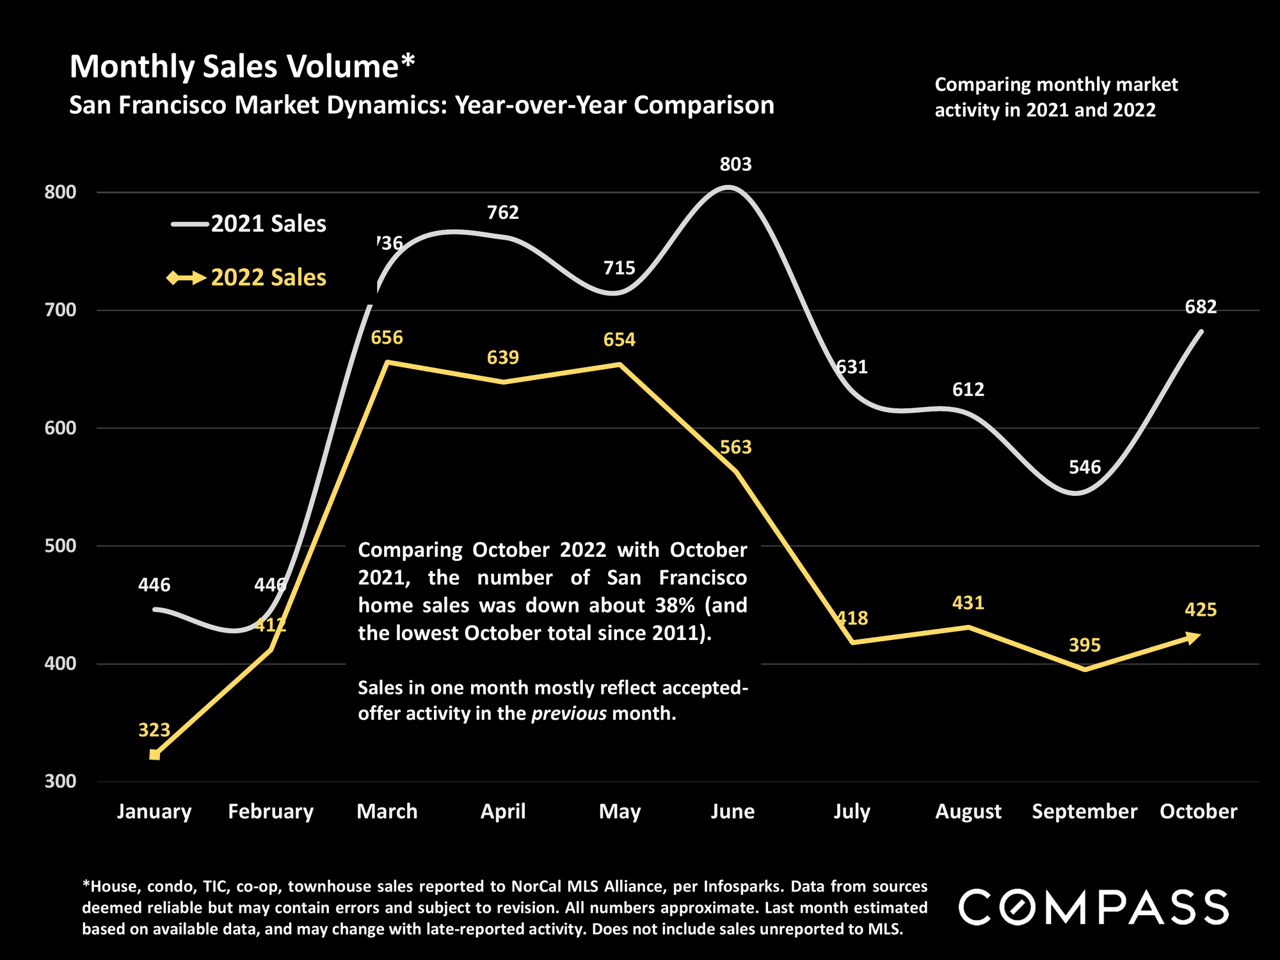
Chart comparing 2021 and 2022 monthly San Francisco home sales, with 2022 below 2021.
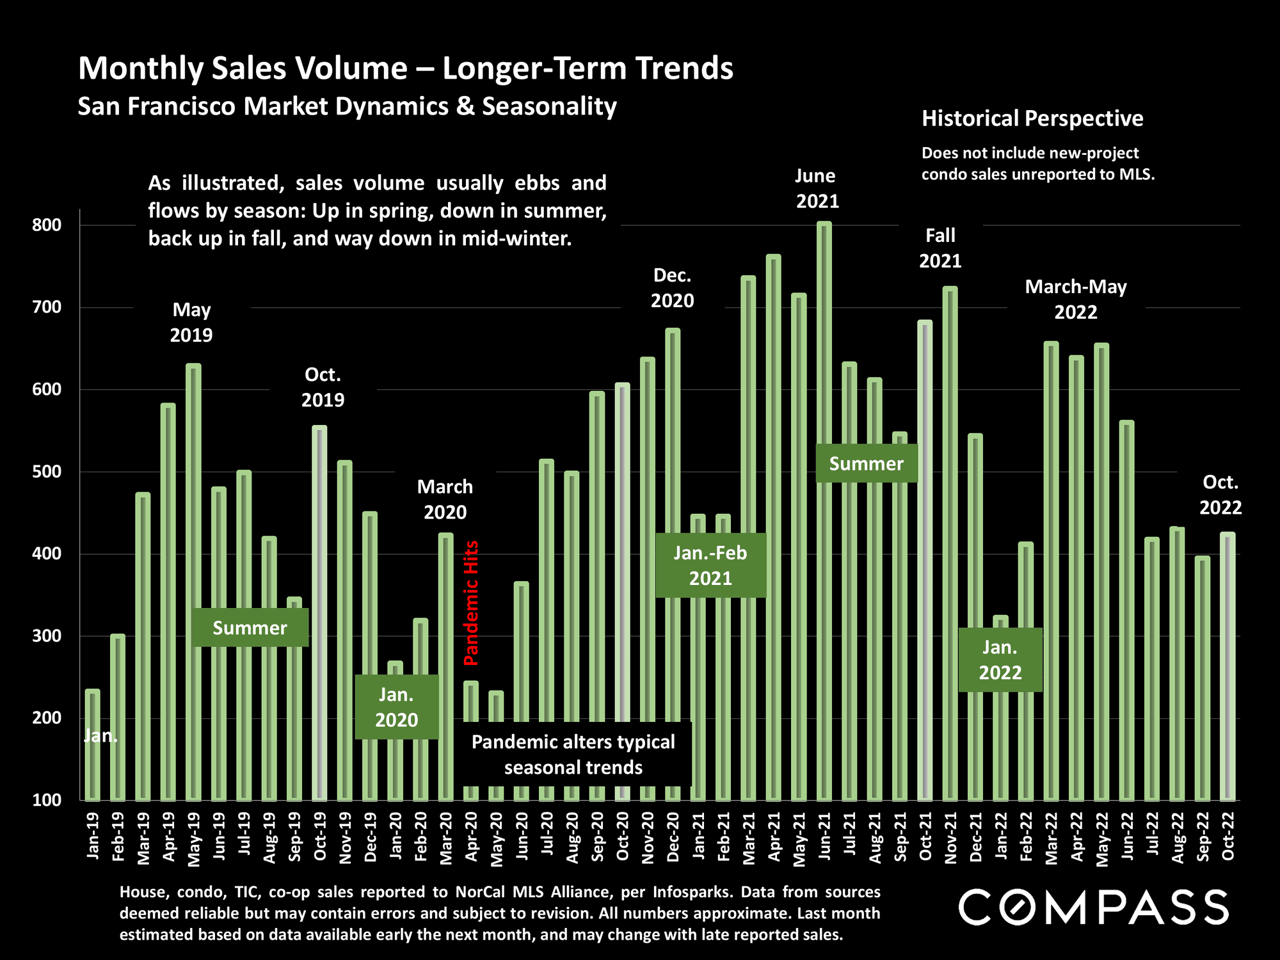
Bar chart of San Francisco monthly home sales from 2019–2022, with seasonal patterns and pandemic-era changes annotated.
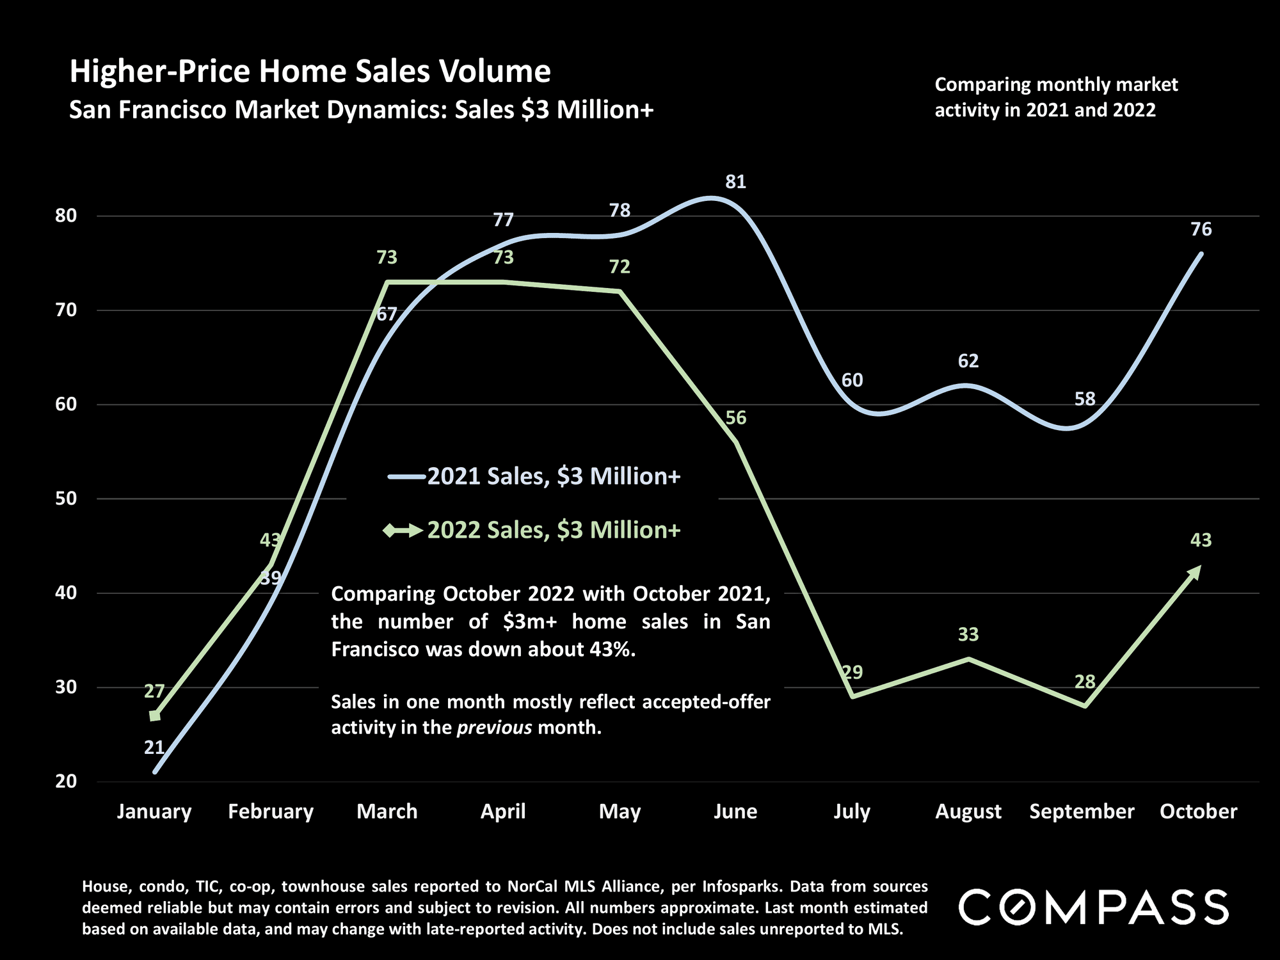
Chart comparing monthly San Francisco sales of homes priced over $3 million in 2021 and 2022.
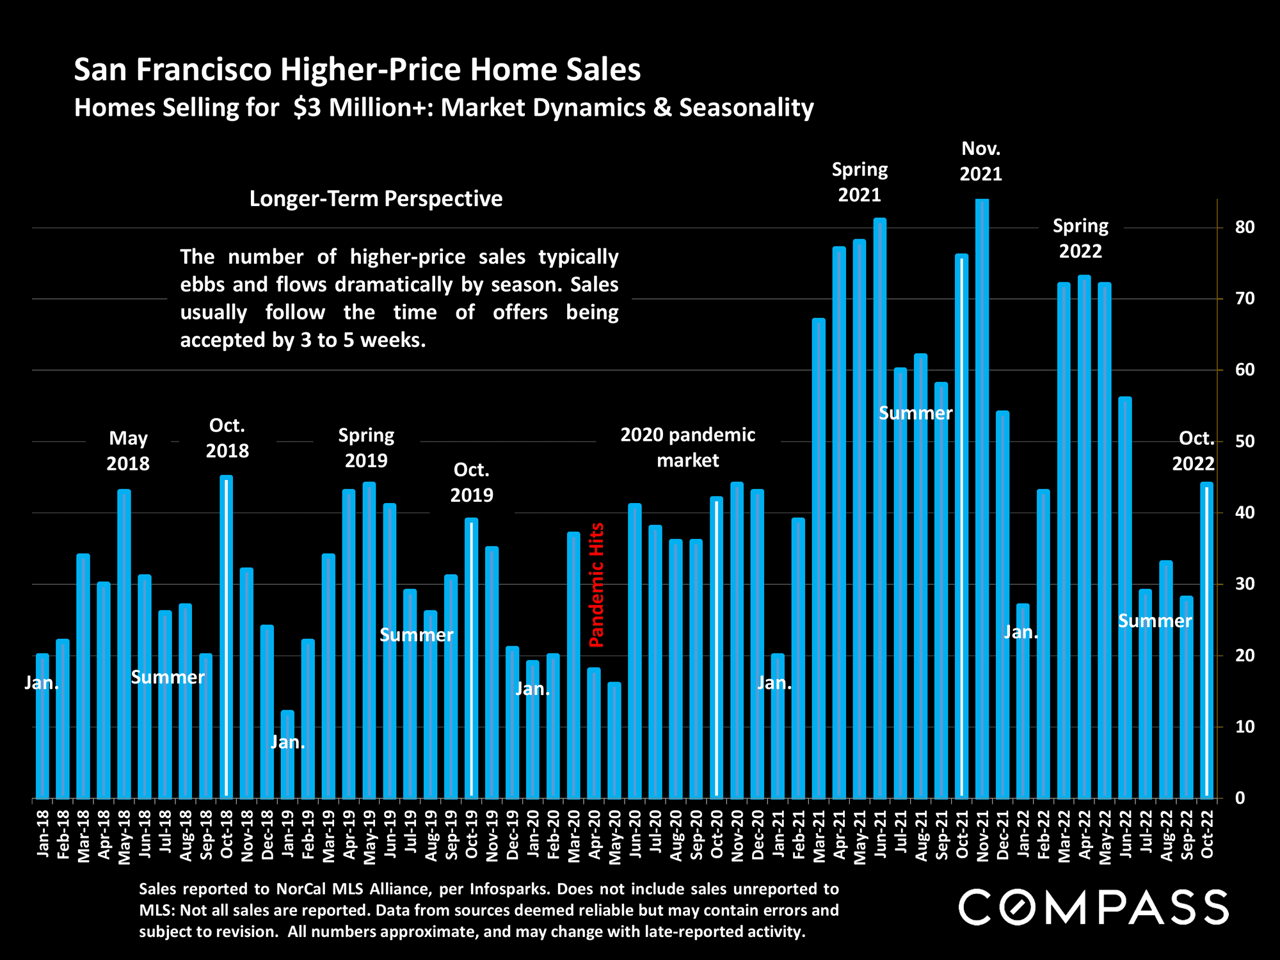
Chart of monthly San Francisco $3 million-plus home sales, January 2018 to October 2022, with seasonal peaks and pandemic annotations.
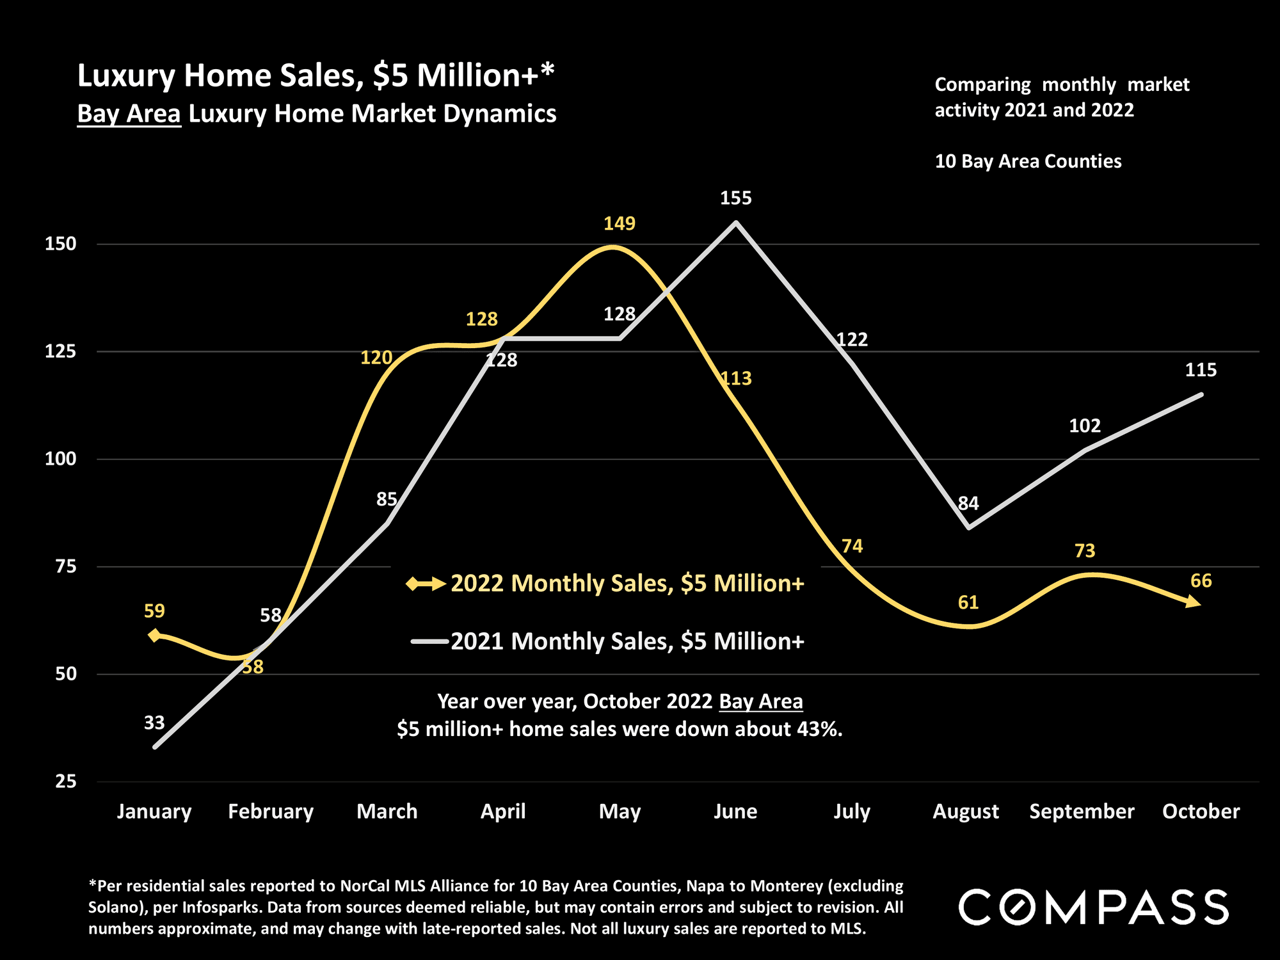
Line chart compares 2021 and 2022 monthly Bay Area home sales above $5 million; October sales fell 43%.
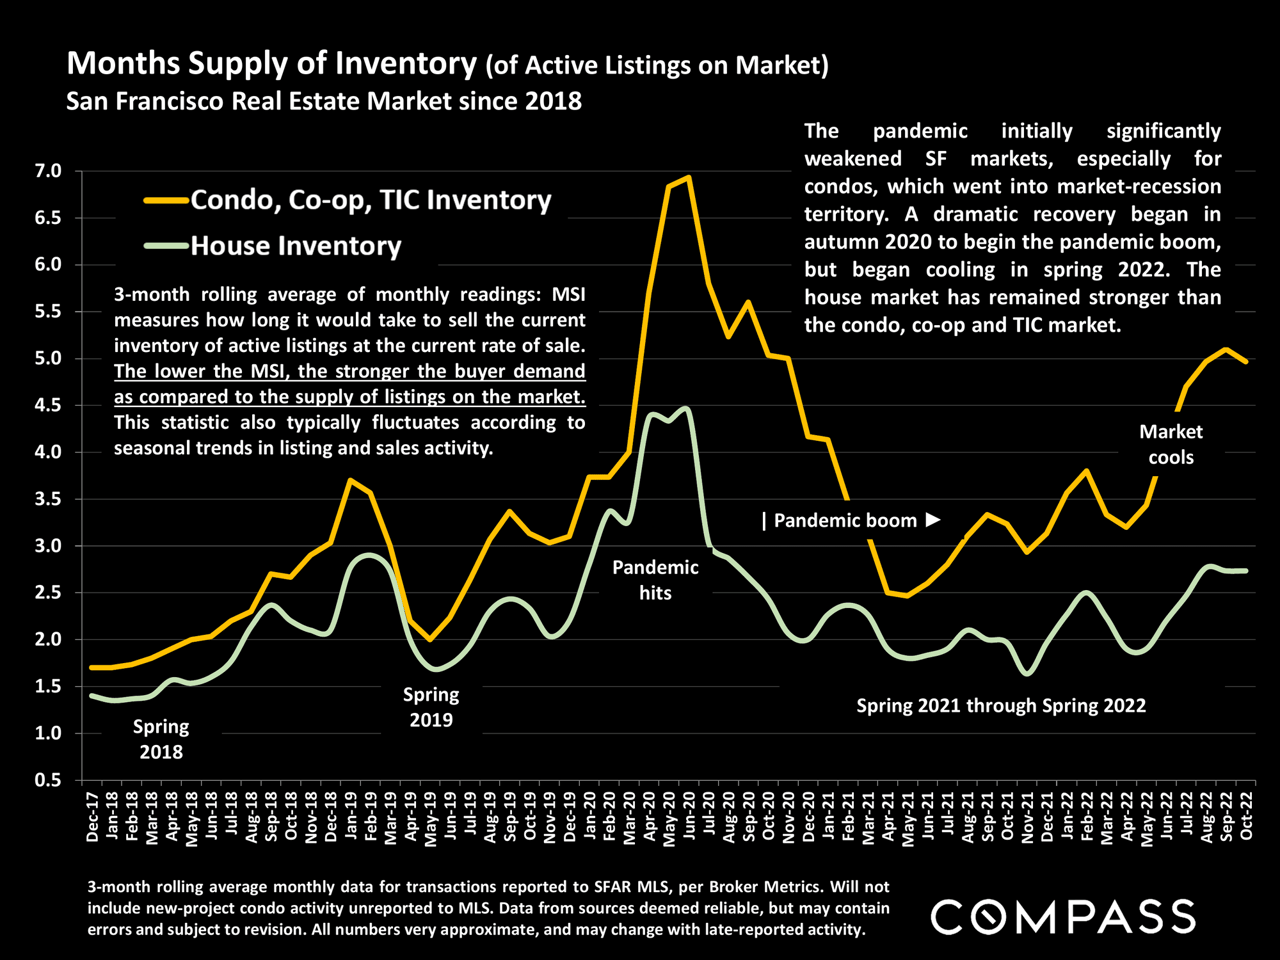
San Francisco inventory chart, showing condo supply peaking in 2020 and house inventory remaining lower through 2022.
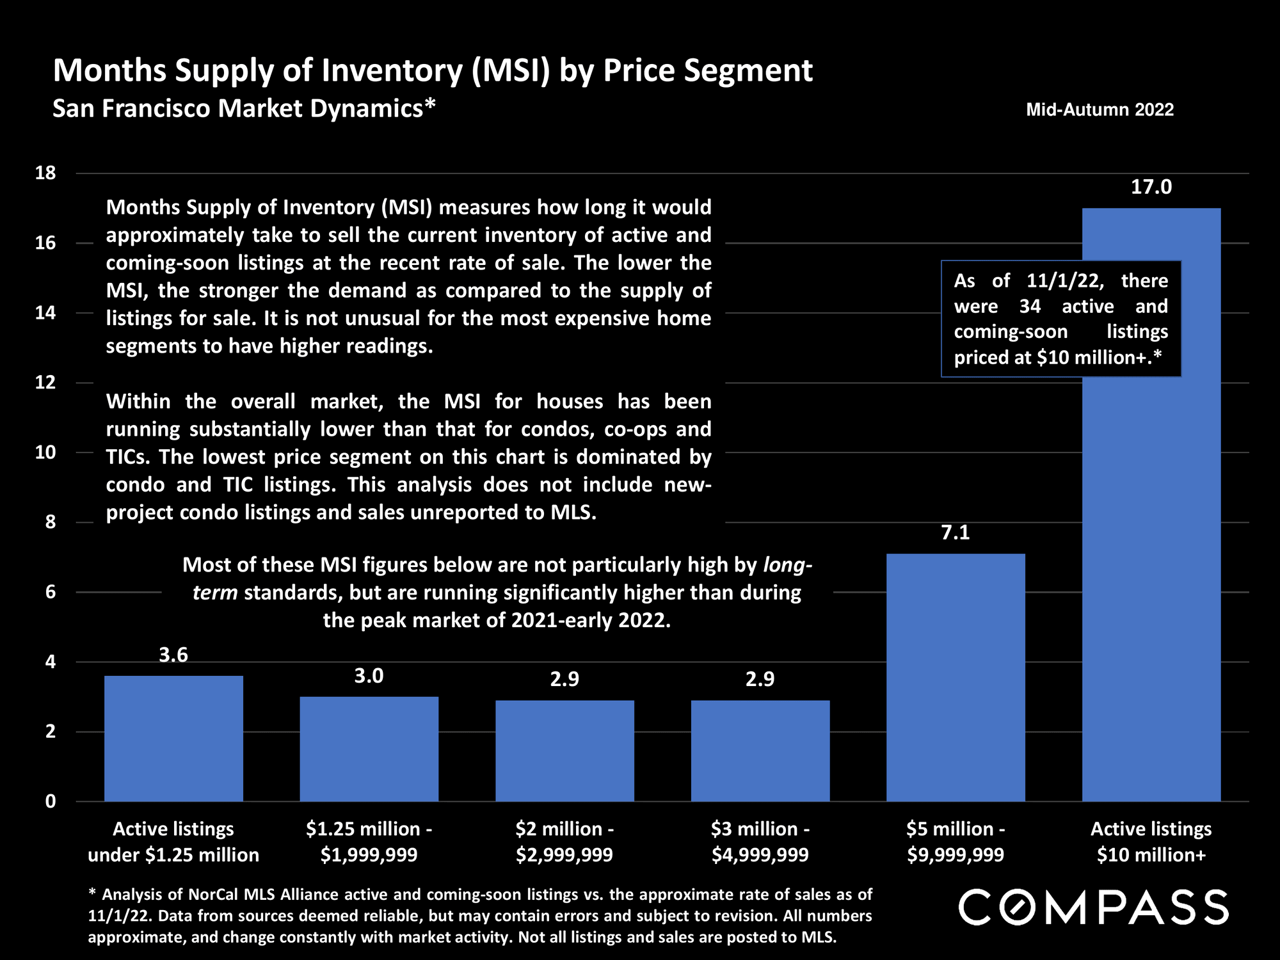
San Francisco inventory supply rises with price: 3.6, 3.0, 2.9, 2.9, 7.1, and 17 months.
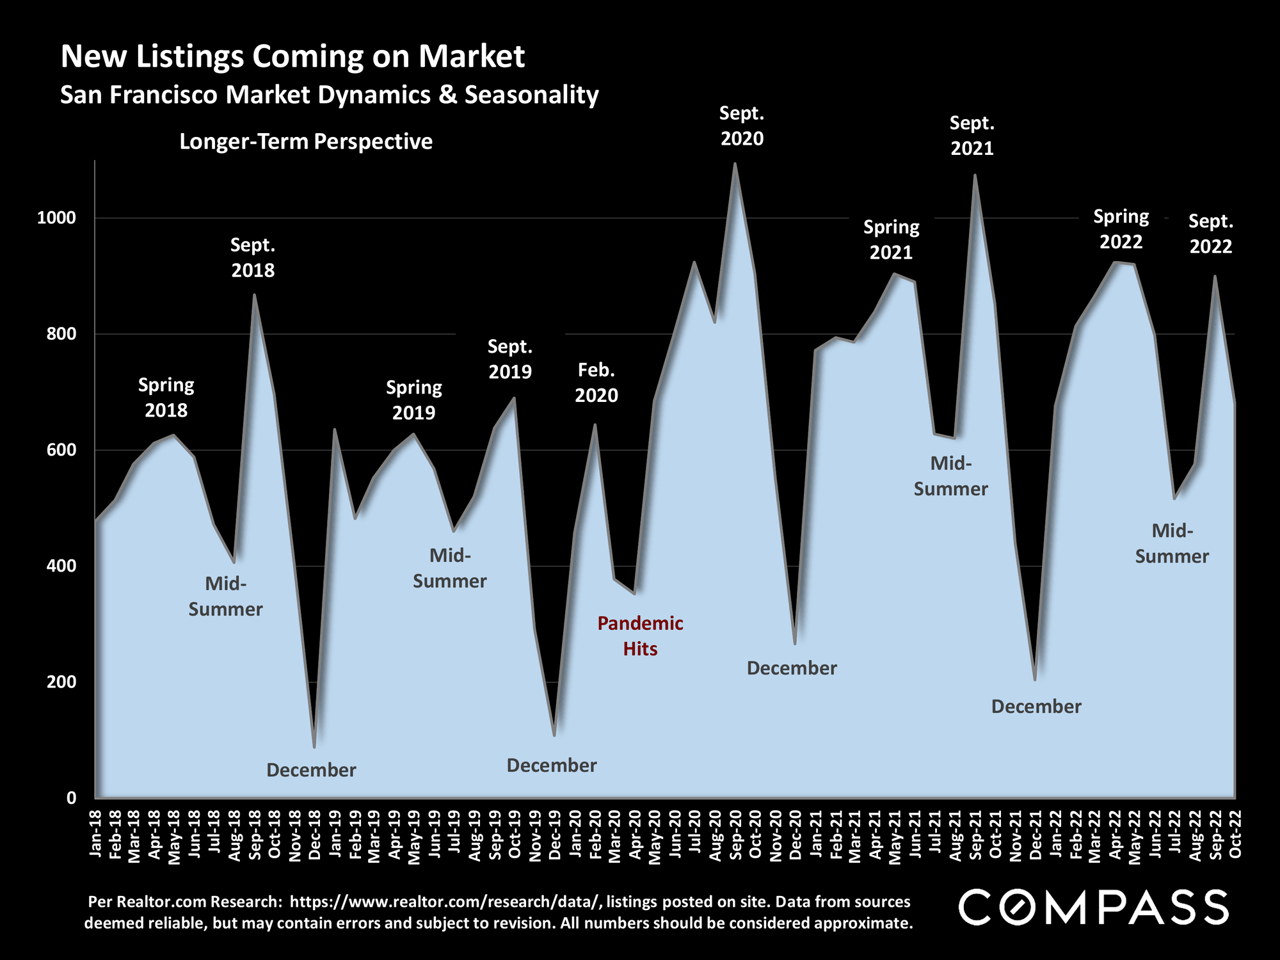
Chart of San Francisco new listings from 2018–2022, showing seasonal peaks, December lows, and a sharp rise after the pandemic began.
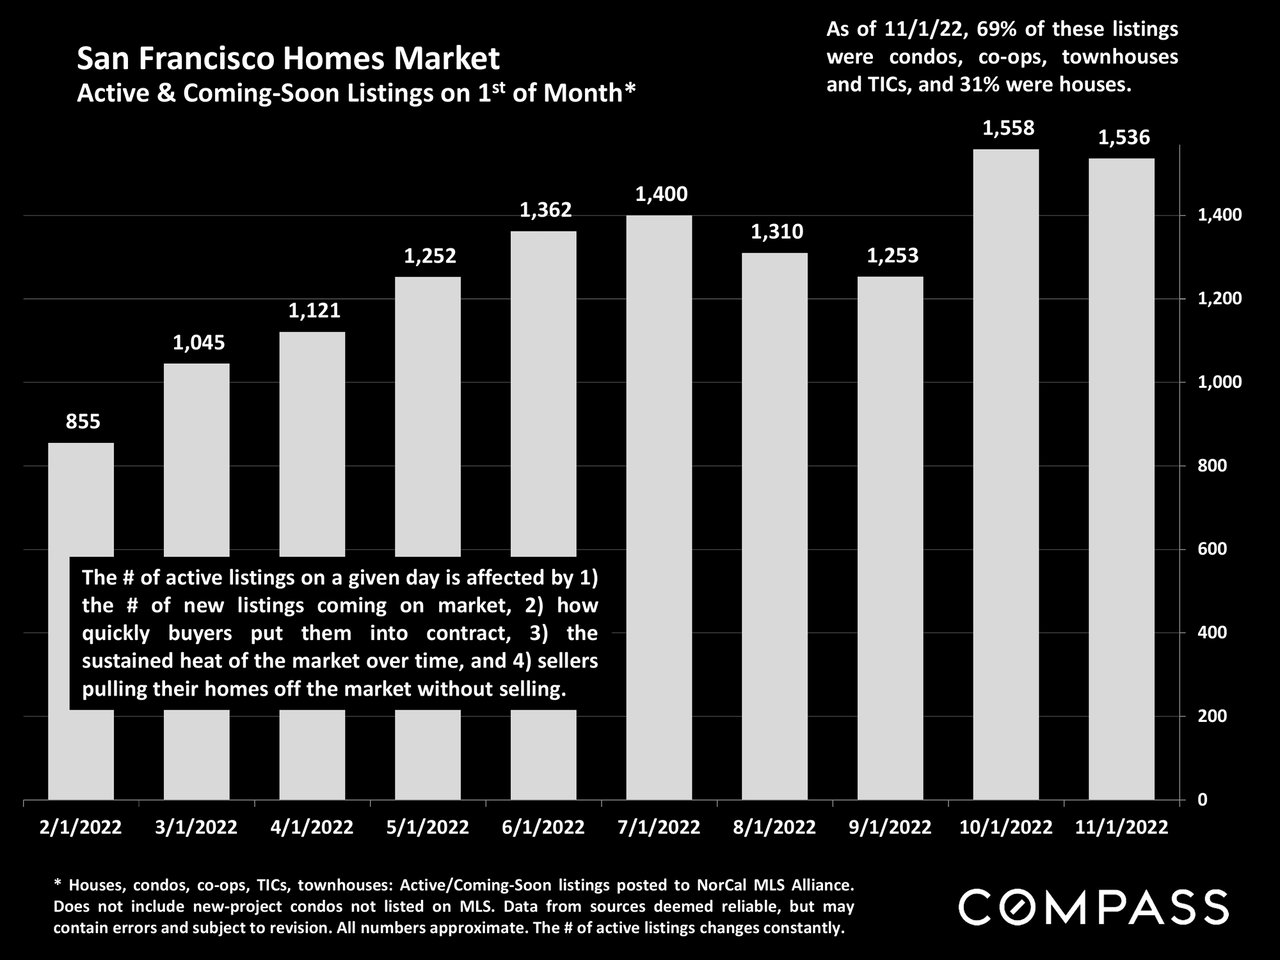
San Francisco active and coming-soon listings chart, with monthly counts peaking in October 2022.
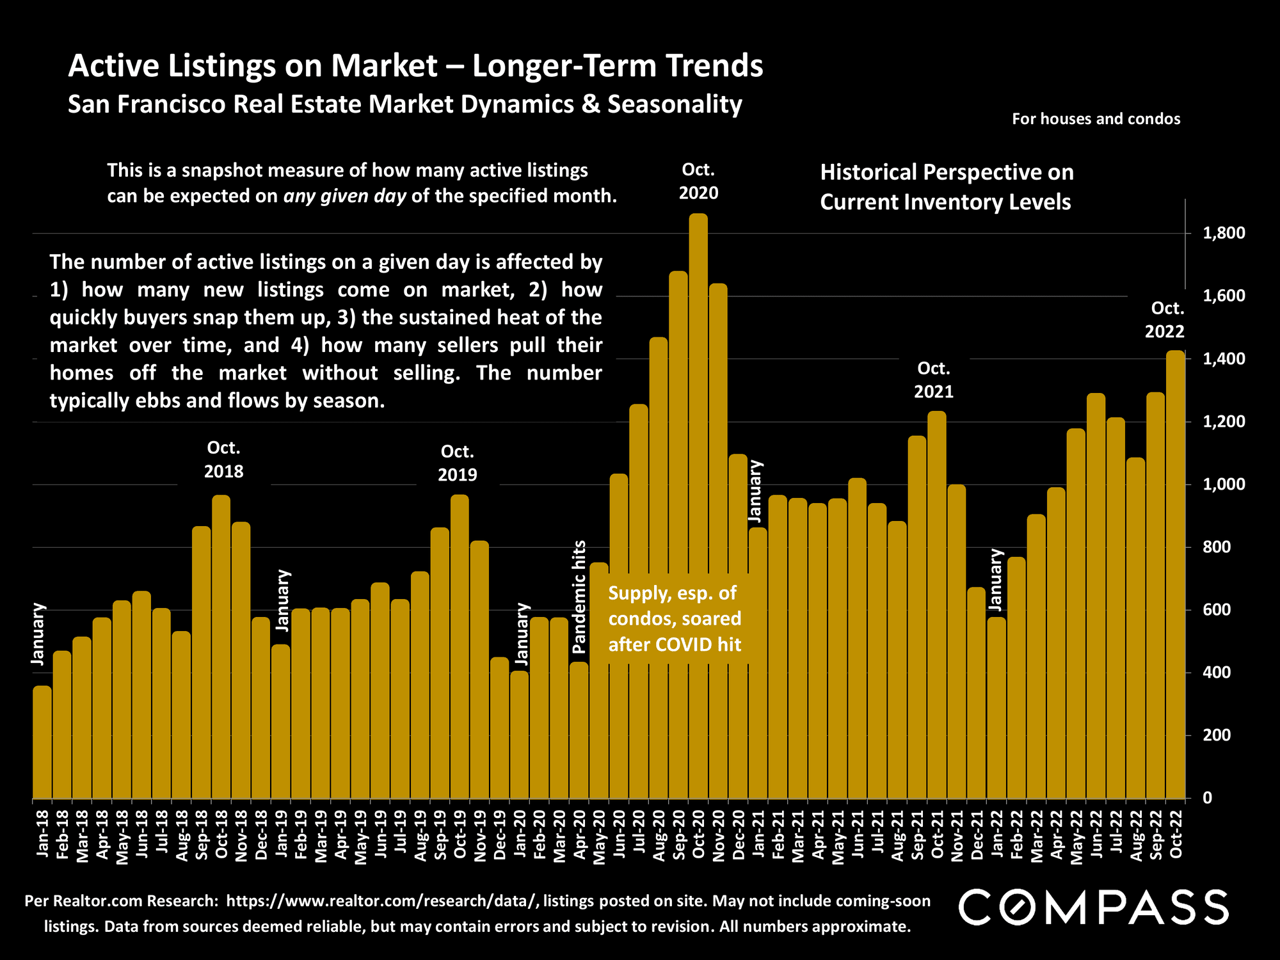
San Francisco active listings chart, showing monthly inventory trends from January 2018 through October 2022.
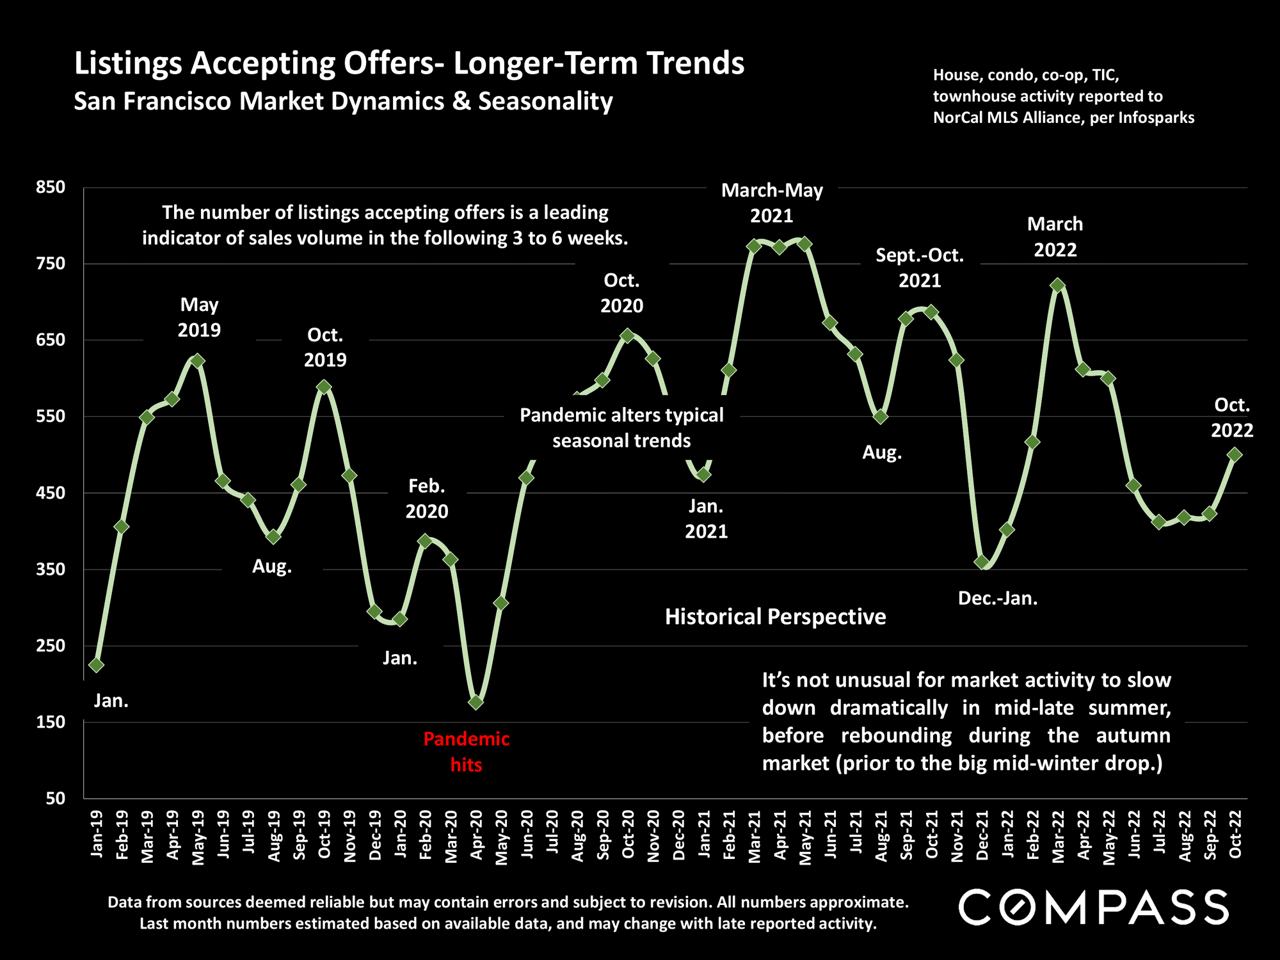
San Francisco listings-accepting-offers chart, showing monthly trends from 2019 to 2022.
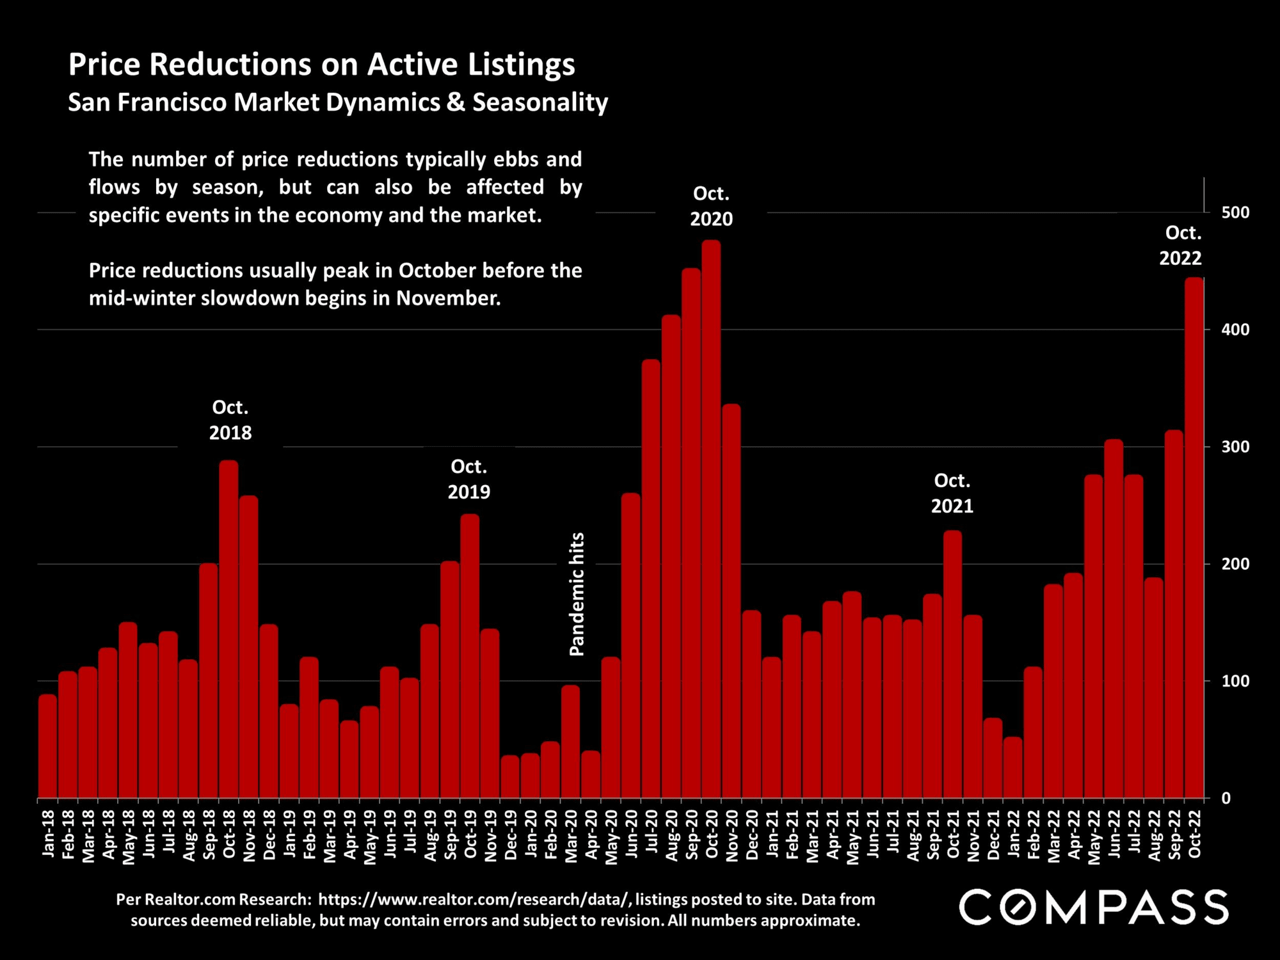
Bar chart of San Francisco active-listing price reductions, peaking in October 2020 and October 2022.
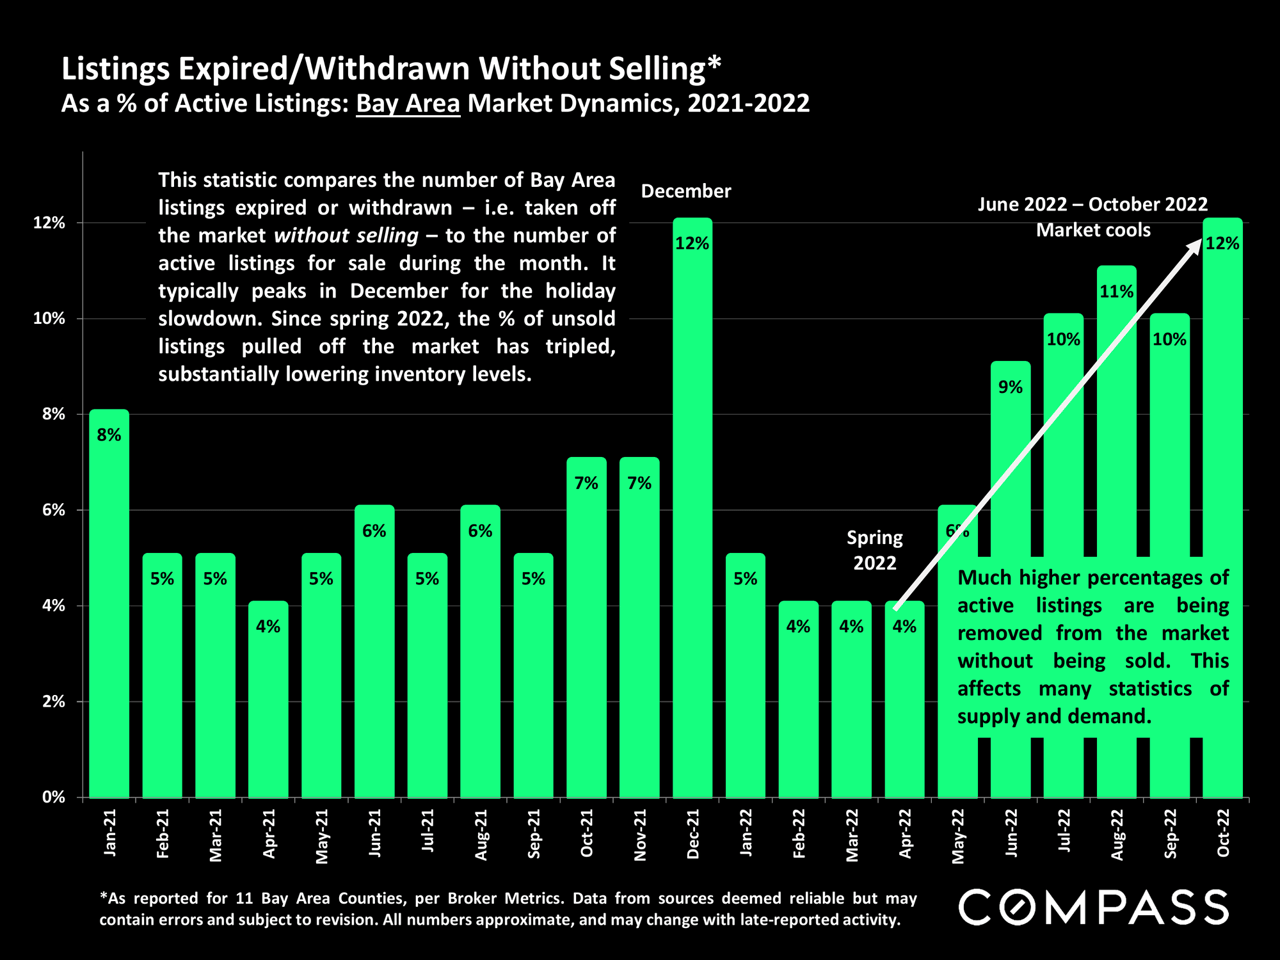
Bay Area unsold listing withdrawals rose to 12% by October 2022.
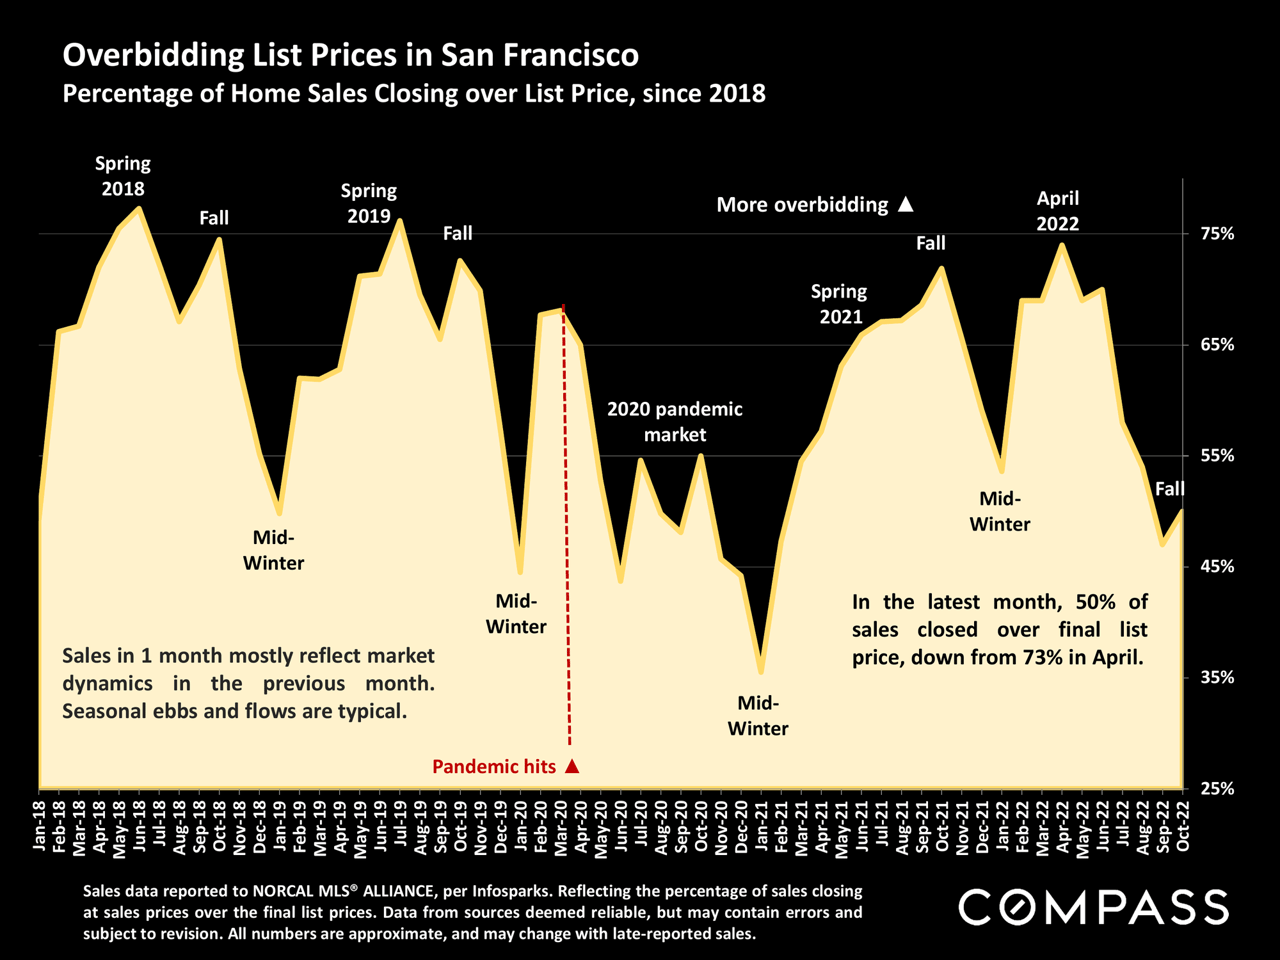
Chart of San Francisco home sales over list price, showing 50% in the latest month, down from 73% in April.
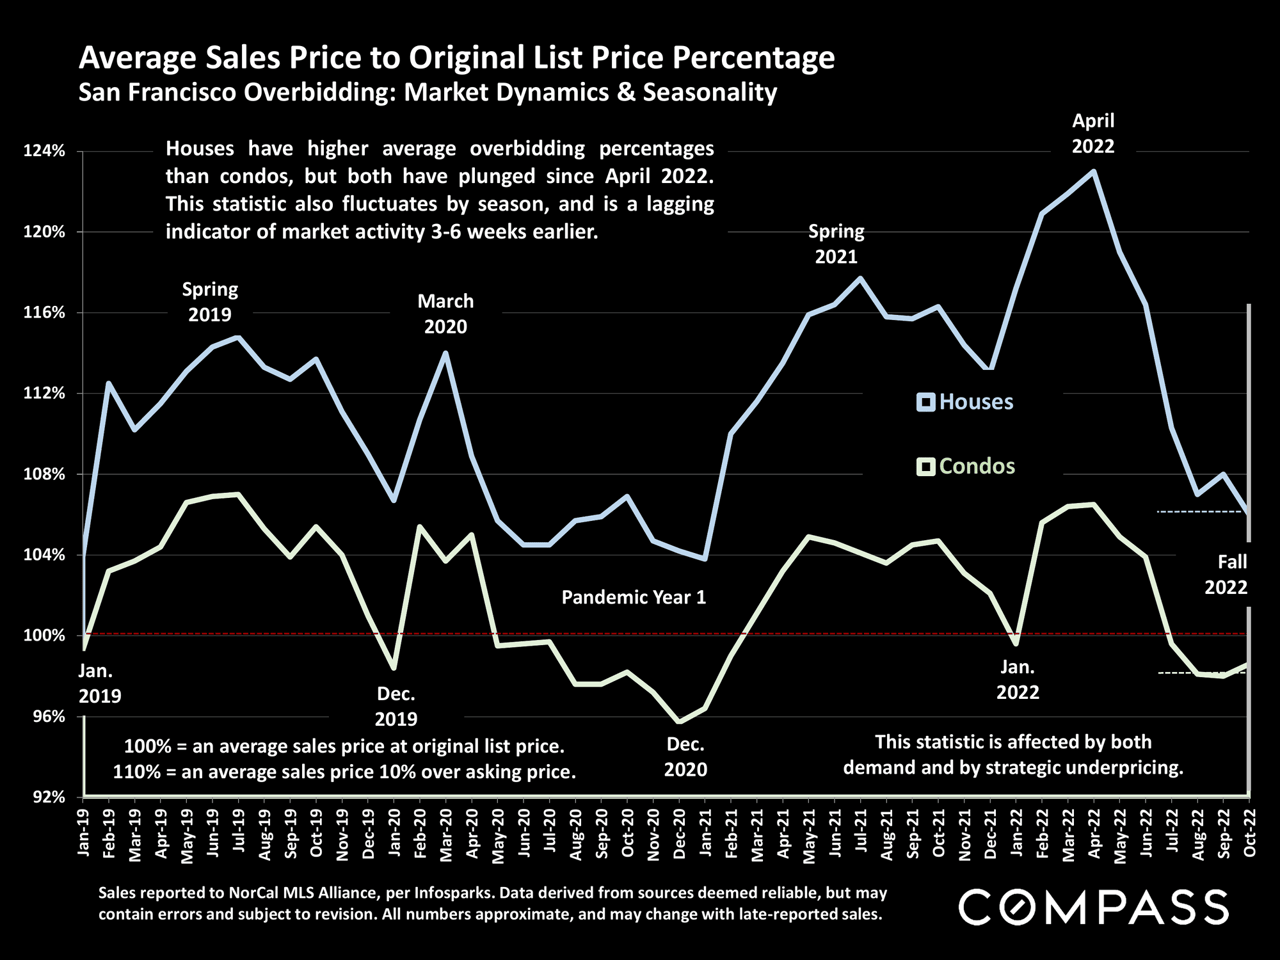
San Francisco chart comparing house and condo sale prices to original list prices, with both overbidding percentages falling in 2022.
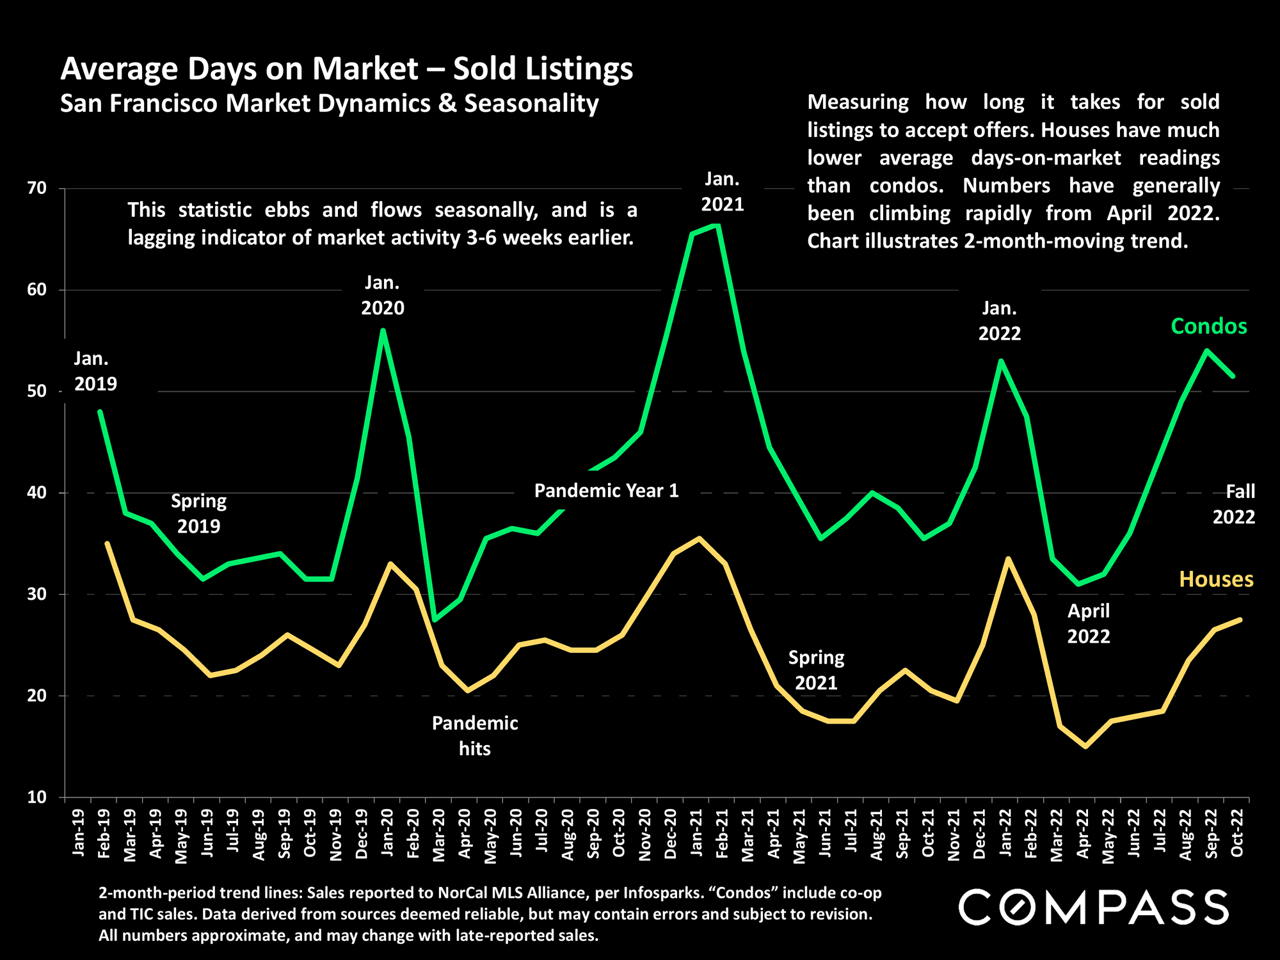
Line chart comparing average days on market for San Francisco houses and condos from 2019 to 2022.
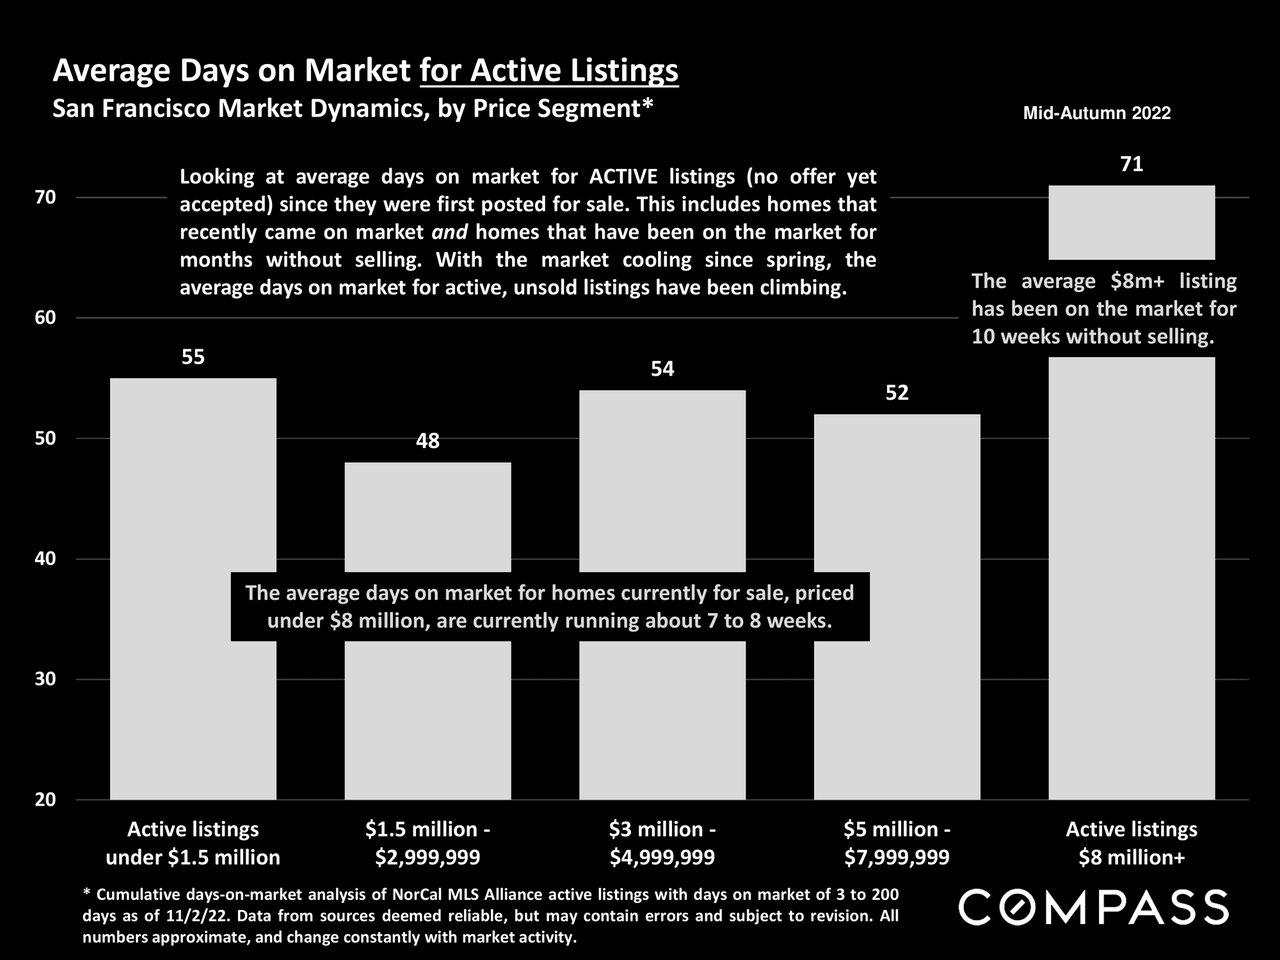
Bar chart shows average days on market by San Francisco price segment, from 48 days to 71 days.
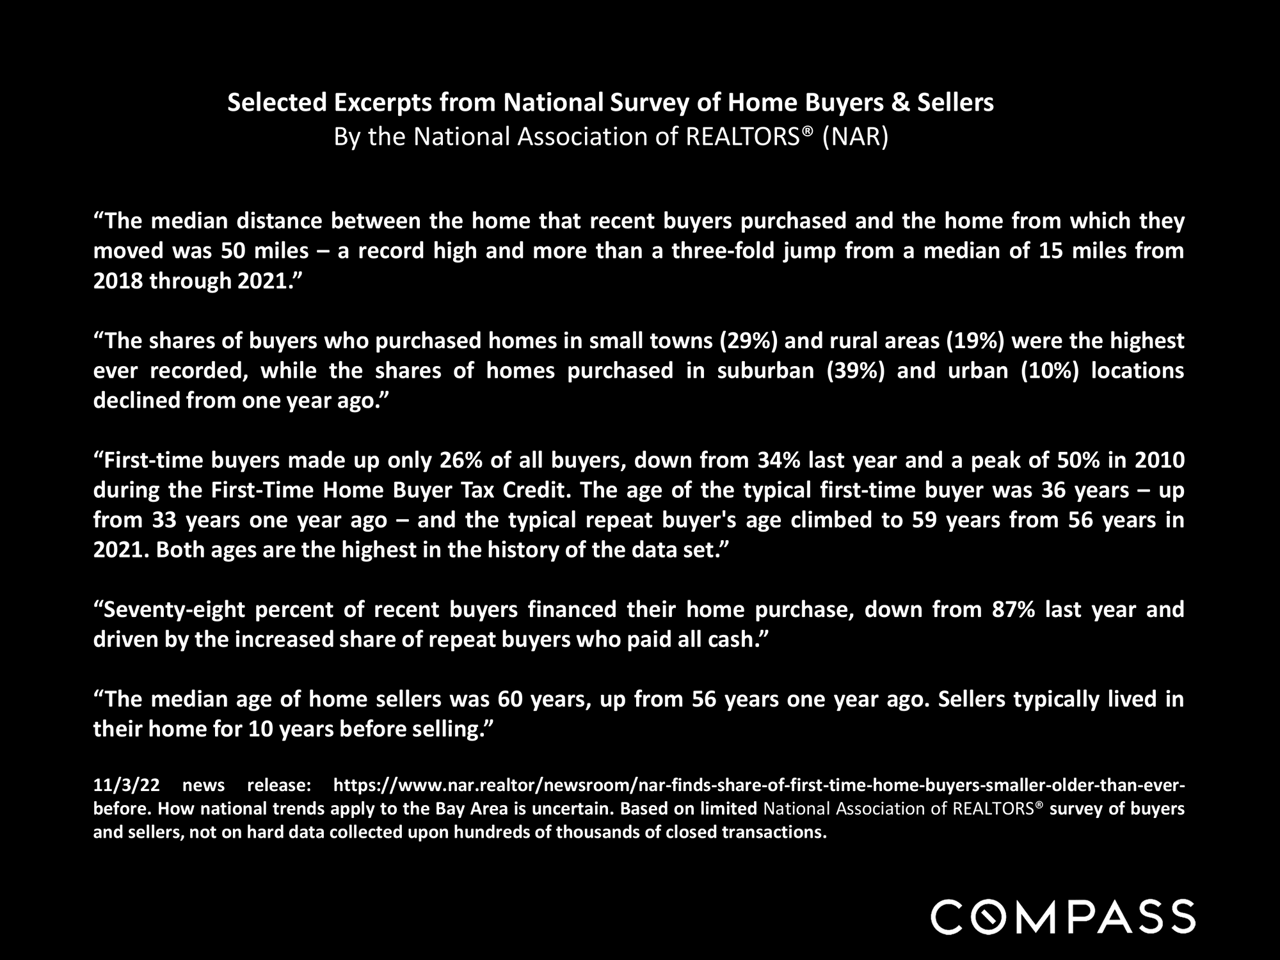
Selected excerpts from a national home buyer and seller survey: findings on moving distance, buyer locations and ages, financing, and seller age, with a Compass wordmark.
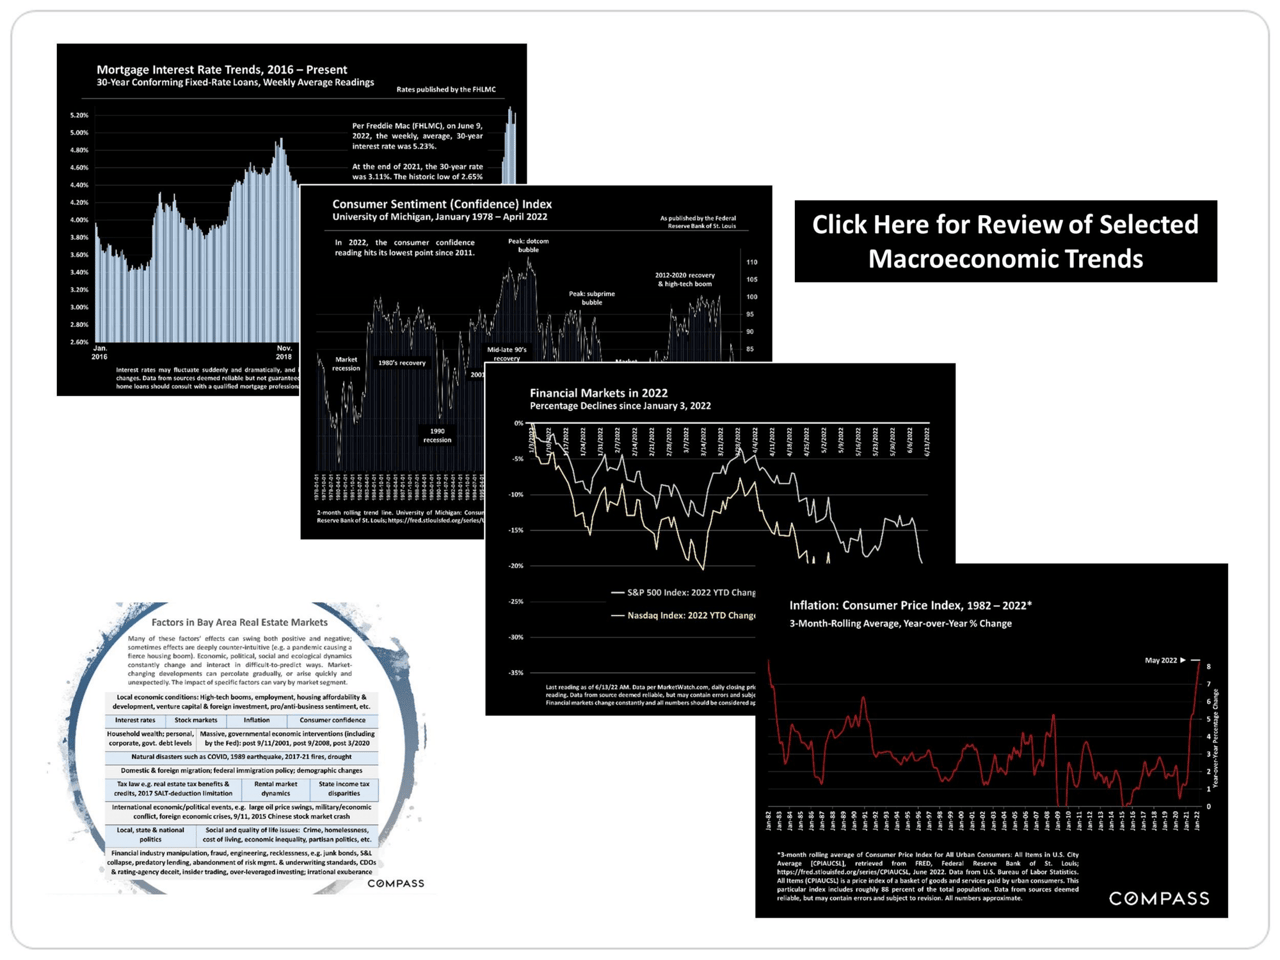
Charts of mortgage rates, consumer sentiment, financial markets, inflation, and Bay Area real estate.
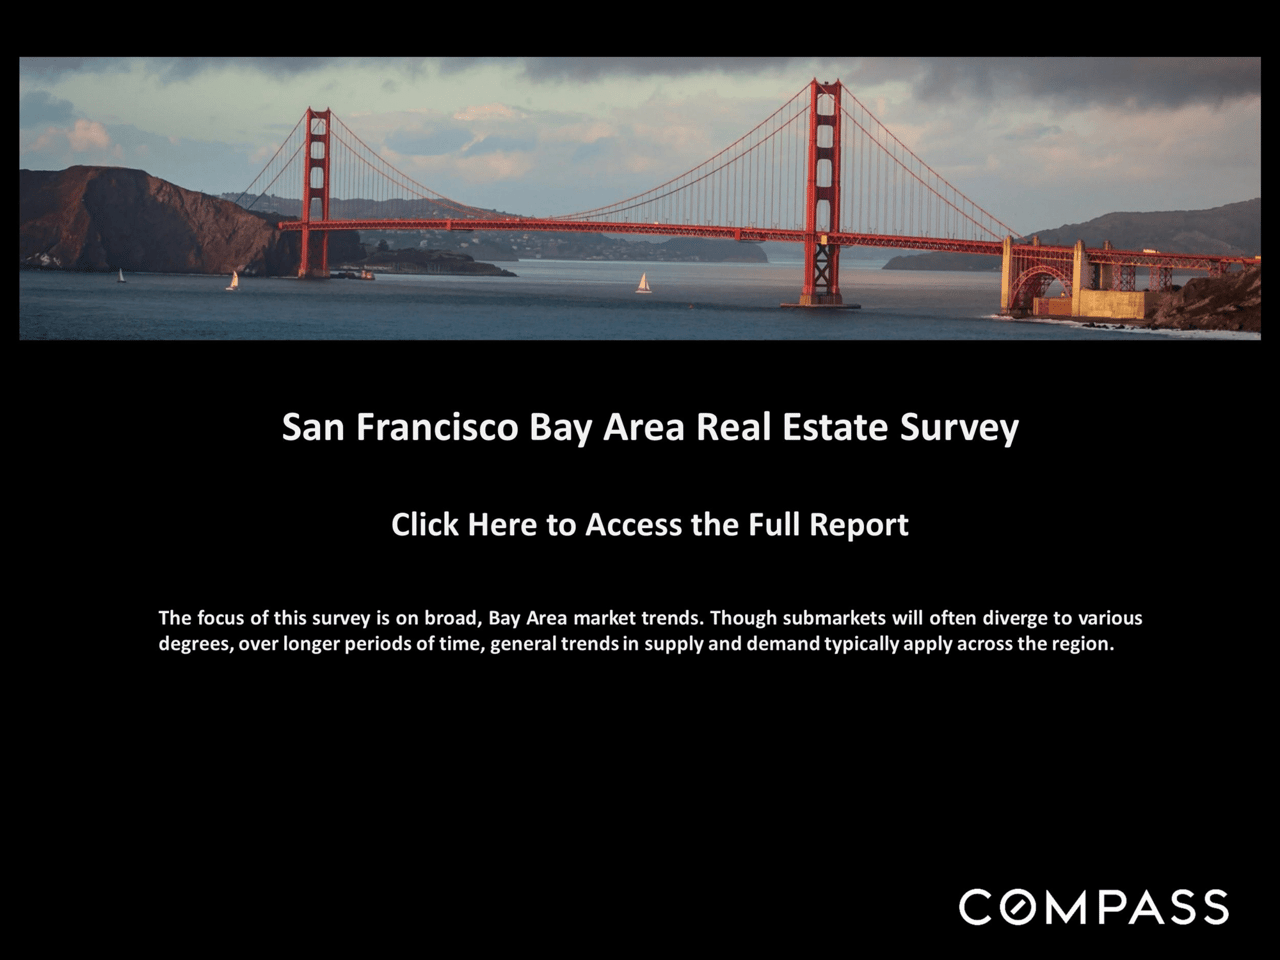
San Francisco Bay Area real estate survey cover featuring the Golden Gate Bridge and Compass branding.
San Francisco Bay Area home price appreciation trends since 1990 report cover.
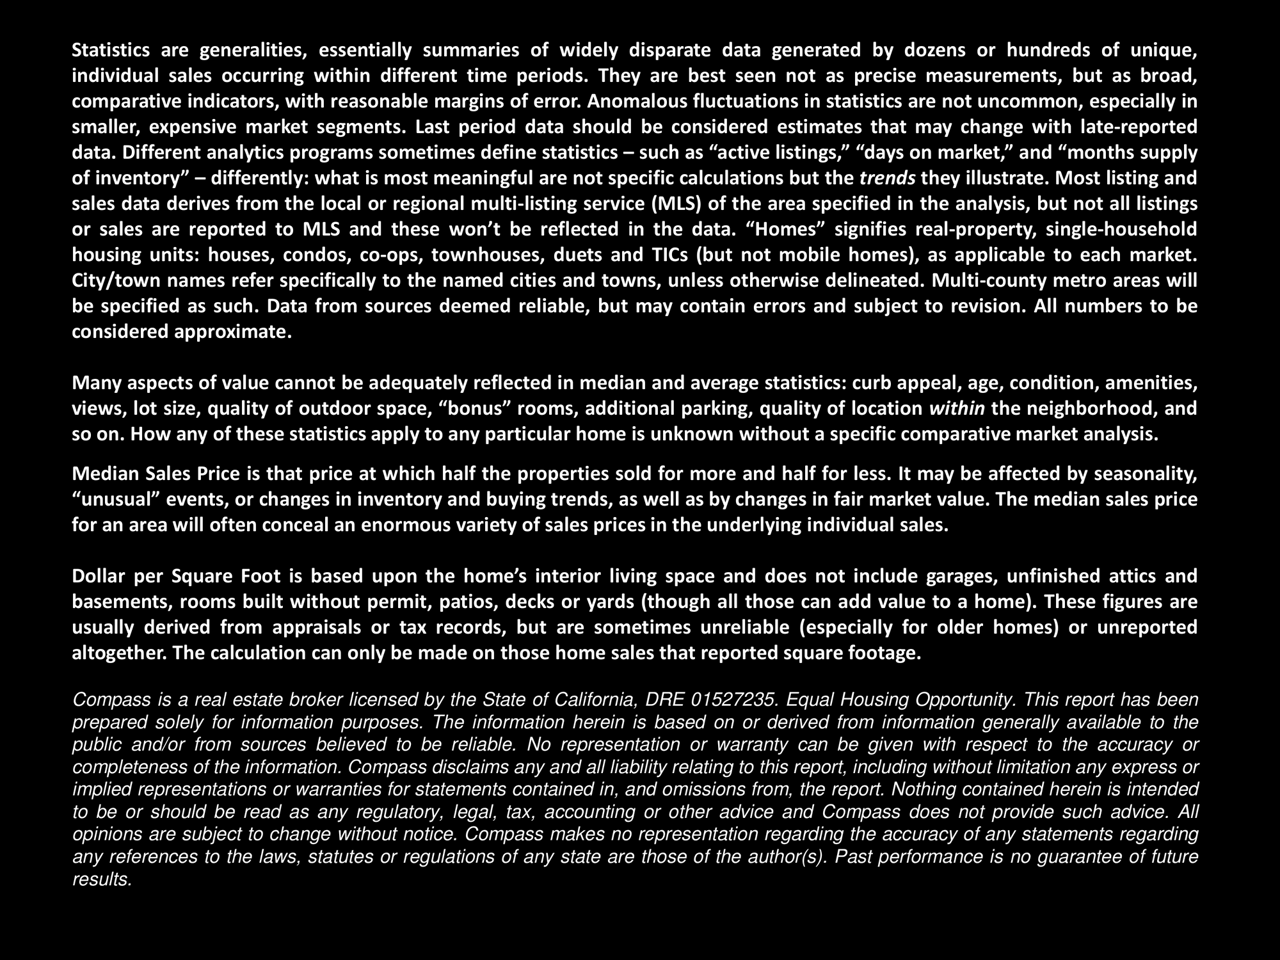
Market report notes explain real estate statistics, median sales price, and dollar per square foot, with a Compass disclaimer.
Tree-framed park path opening onto a green lawn and San Francisco skyline

Let’s Work Together

I love people and connecting with new opportunities. Let's talk about what's next for you, wherever you call home.