San Francisco Real Estate October 2023 Report
Market report on Q3 home sales and prices, with the California Association of Realtors’ 2024 forecast.
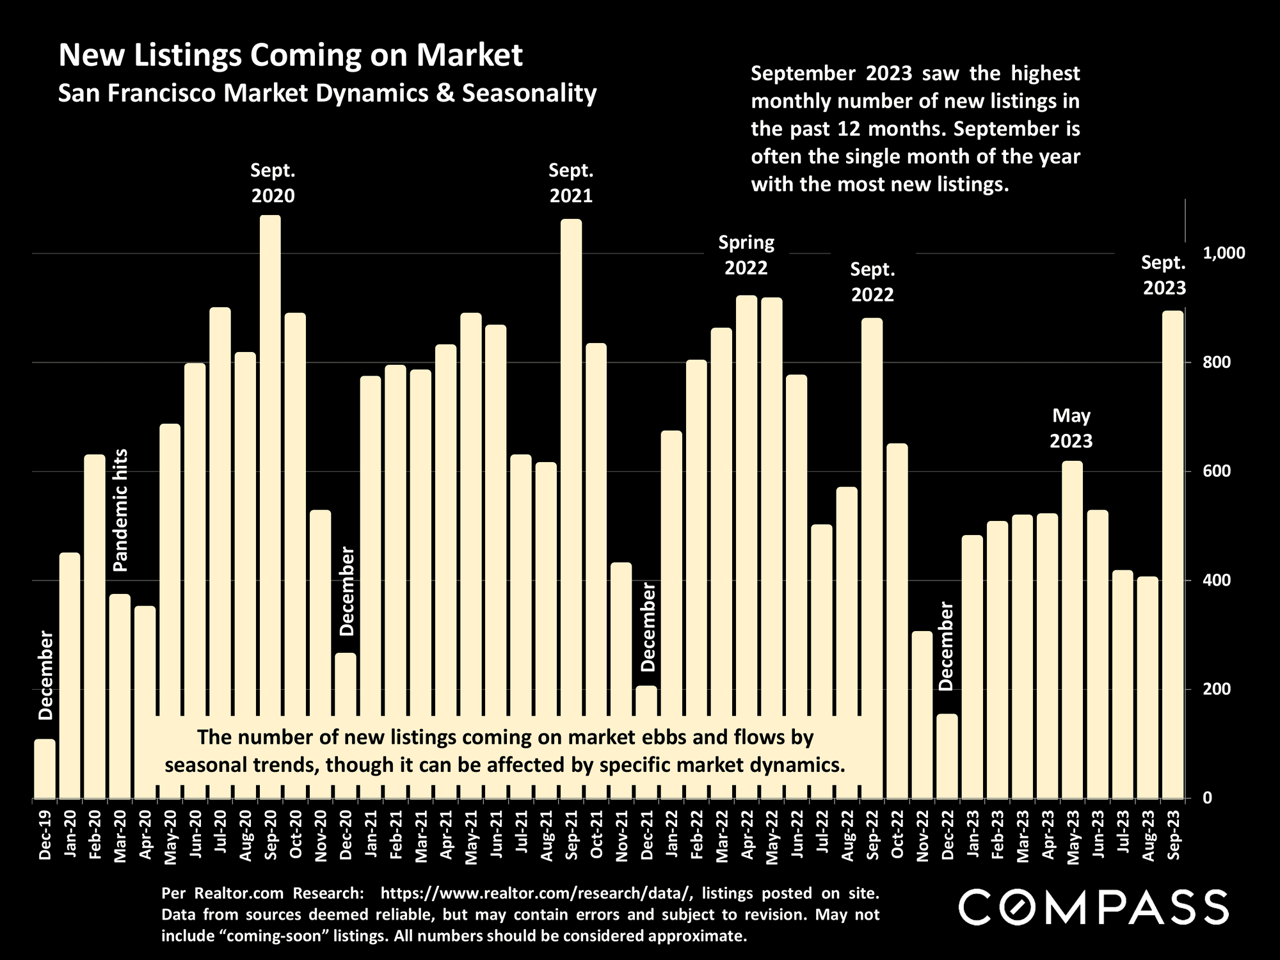
Bar chart of San Francisco new listings, December 2019–September 2023, highlighting September 2023’s 12-month high.
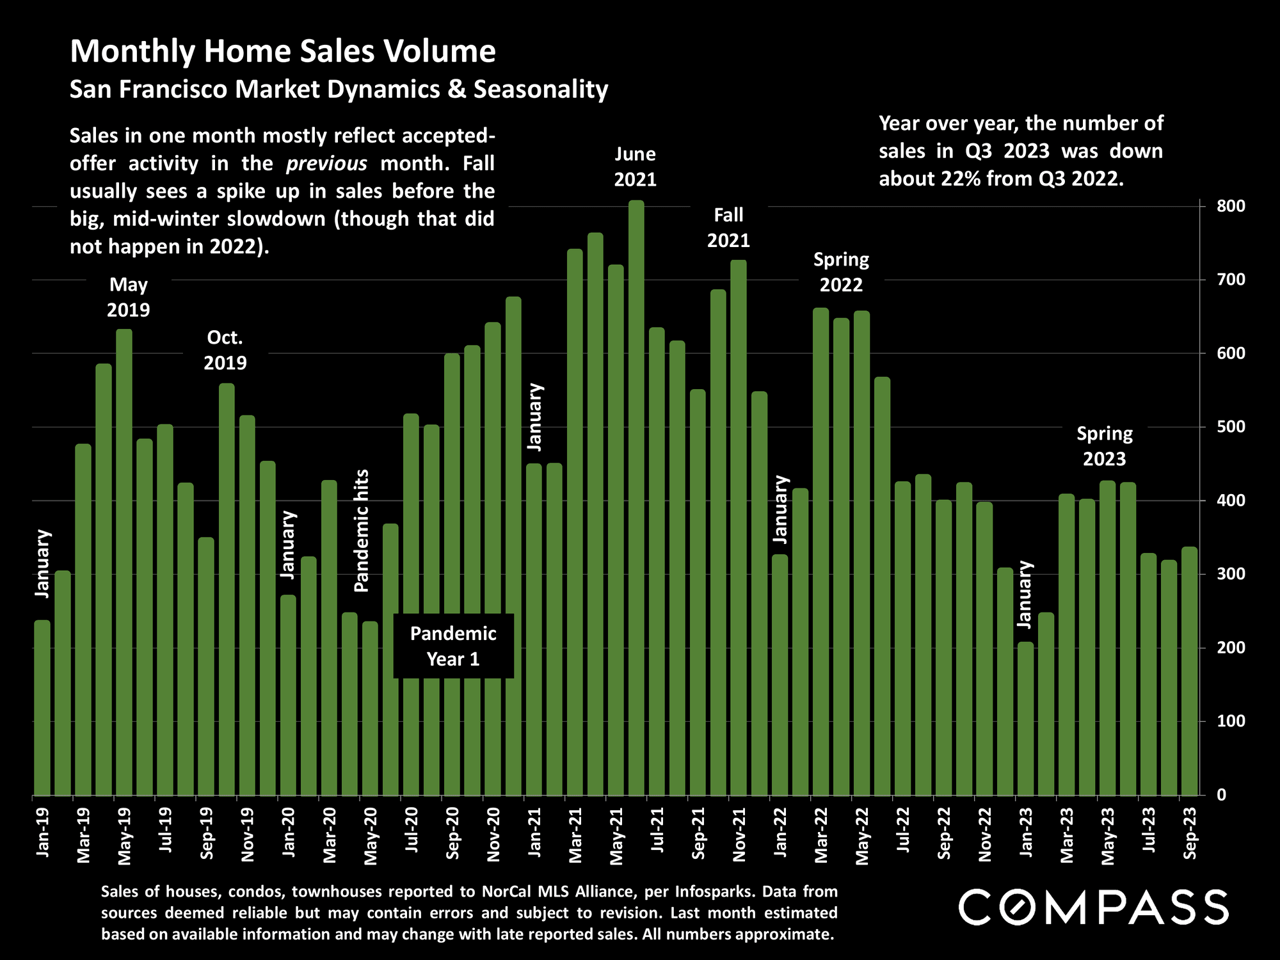
San Francisco monthly home sales chart, January 2019–September 2023, with seasonal and pandemic annotations.
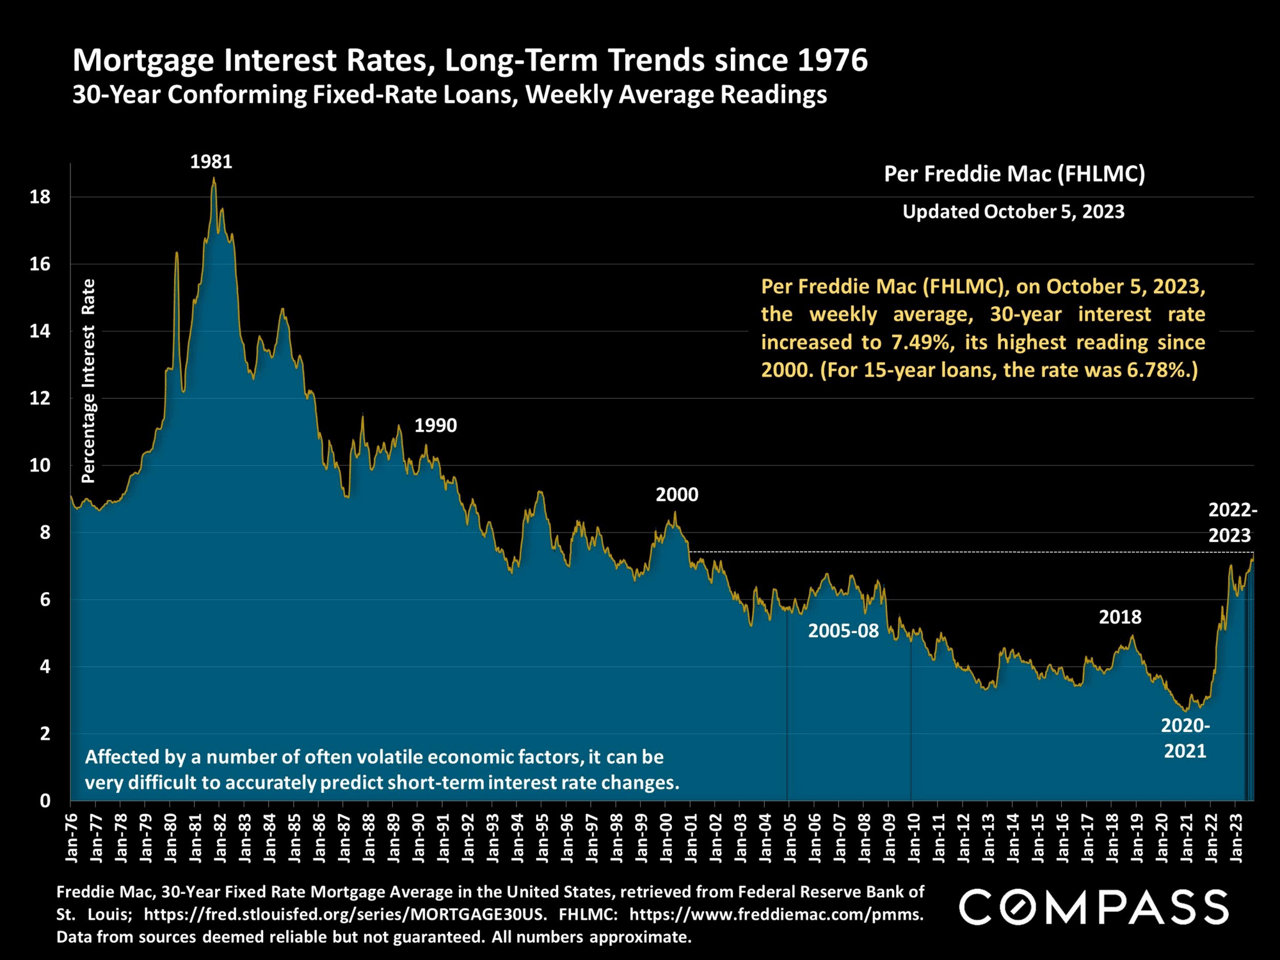
Chart of U.S. 30-year fixed mortgage rates from 1976 to 2023, rising sharply to 7.49% in October 2023.
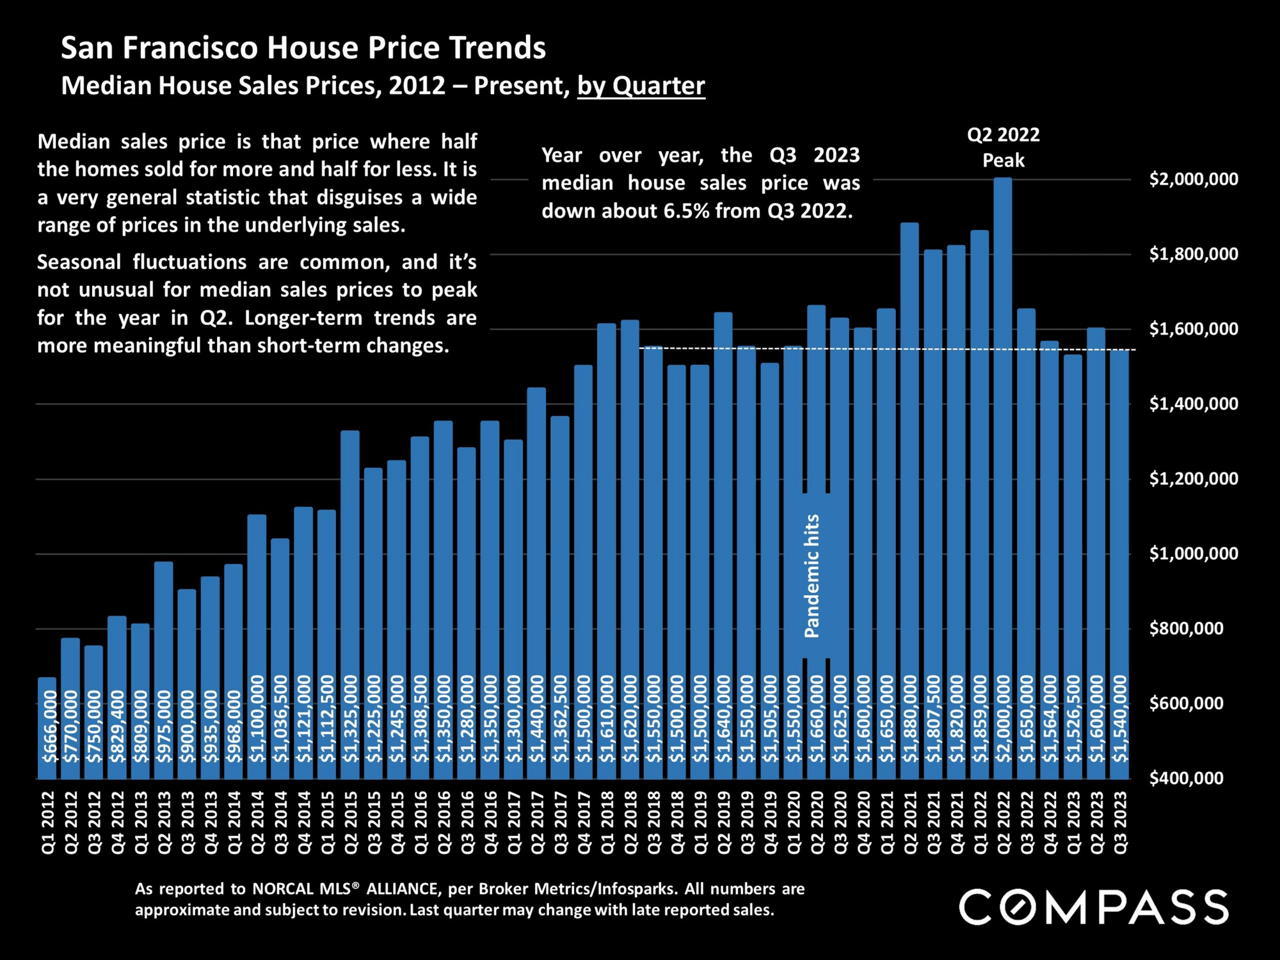
San Francisco quarterly median house prices, rising to a Q2 2022 peak before declining through Q3 2023.
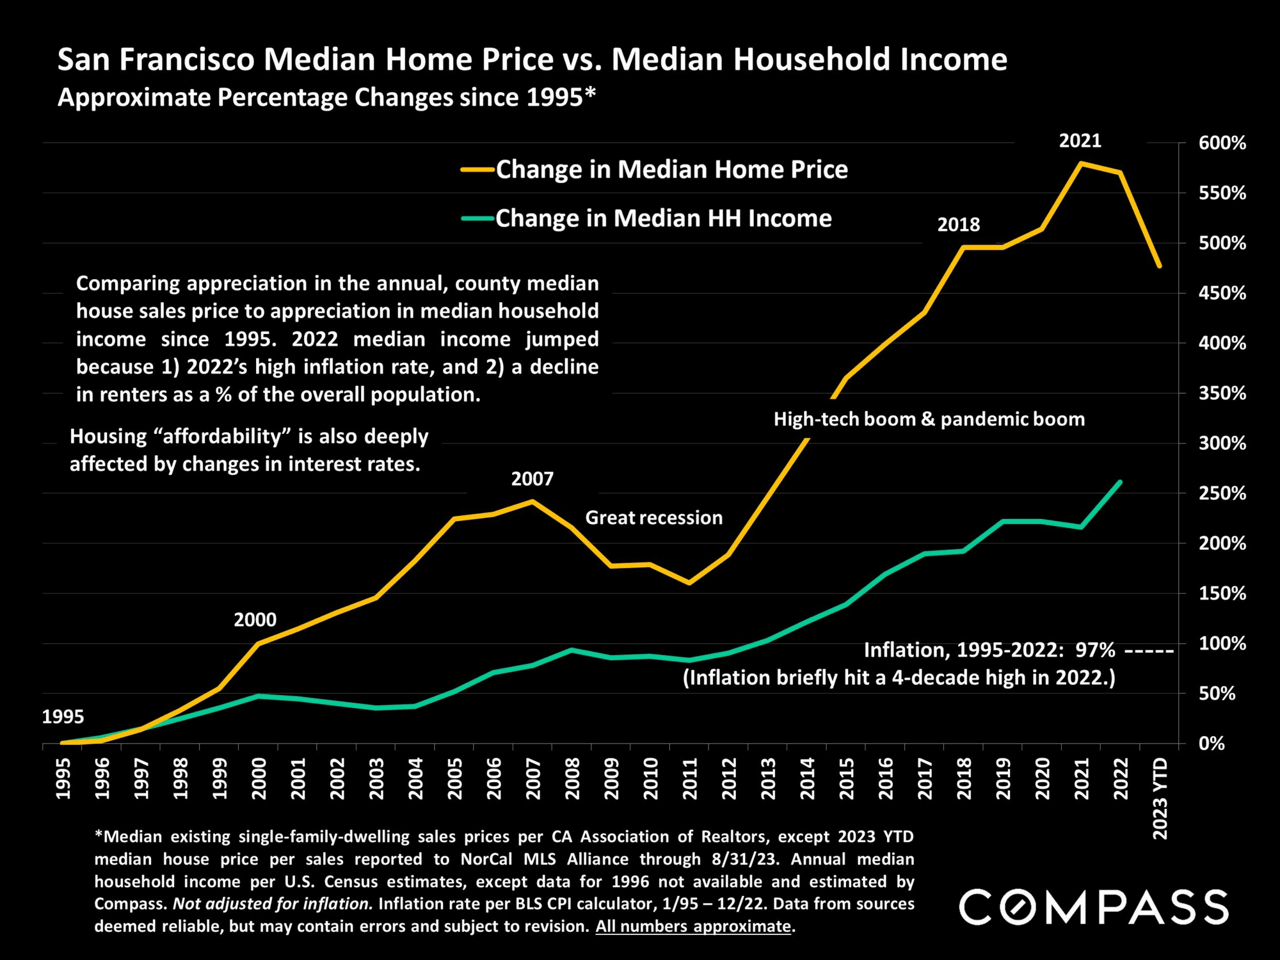
Chart shows San Francisco home prices rising far faster than household incomes since 1995.
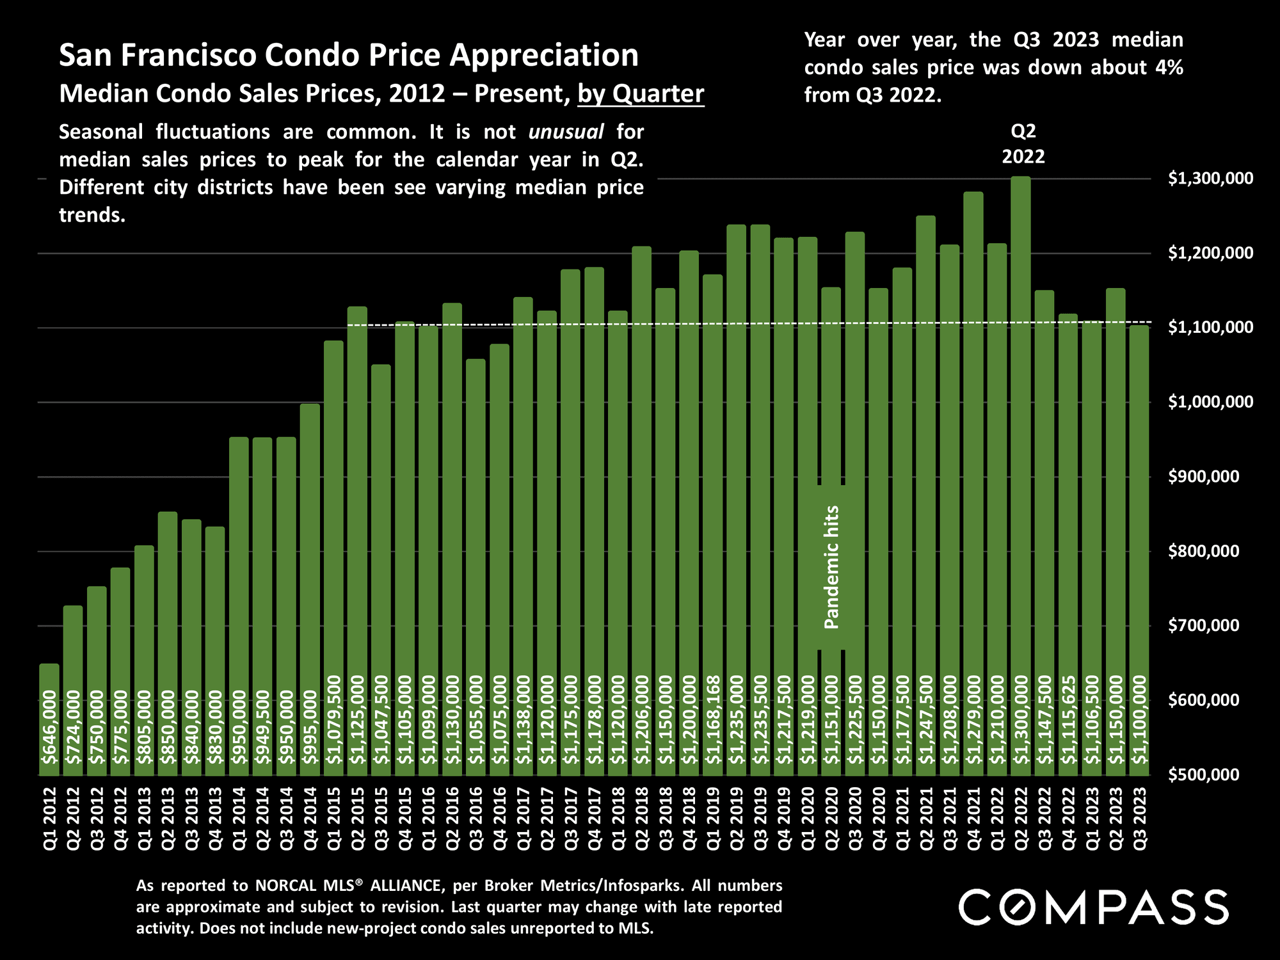
Chart of quarterly San Francisco condo prices, 2012–2023, peaking at $1.3 million in Q2 2022.
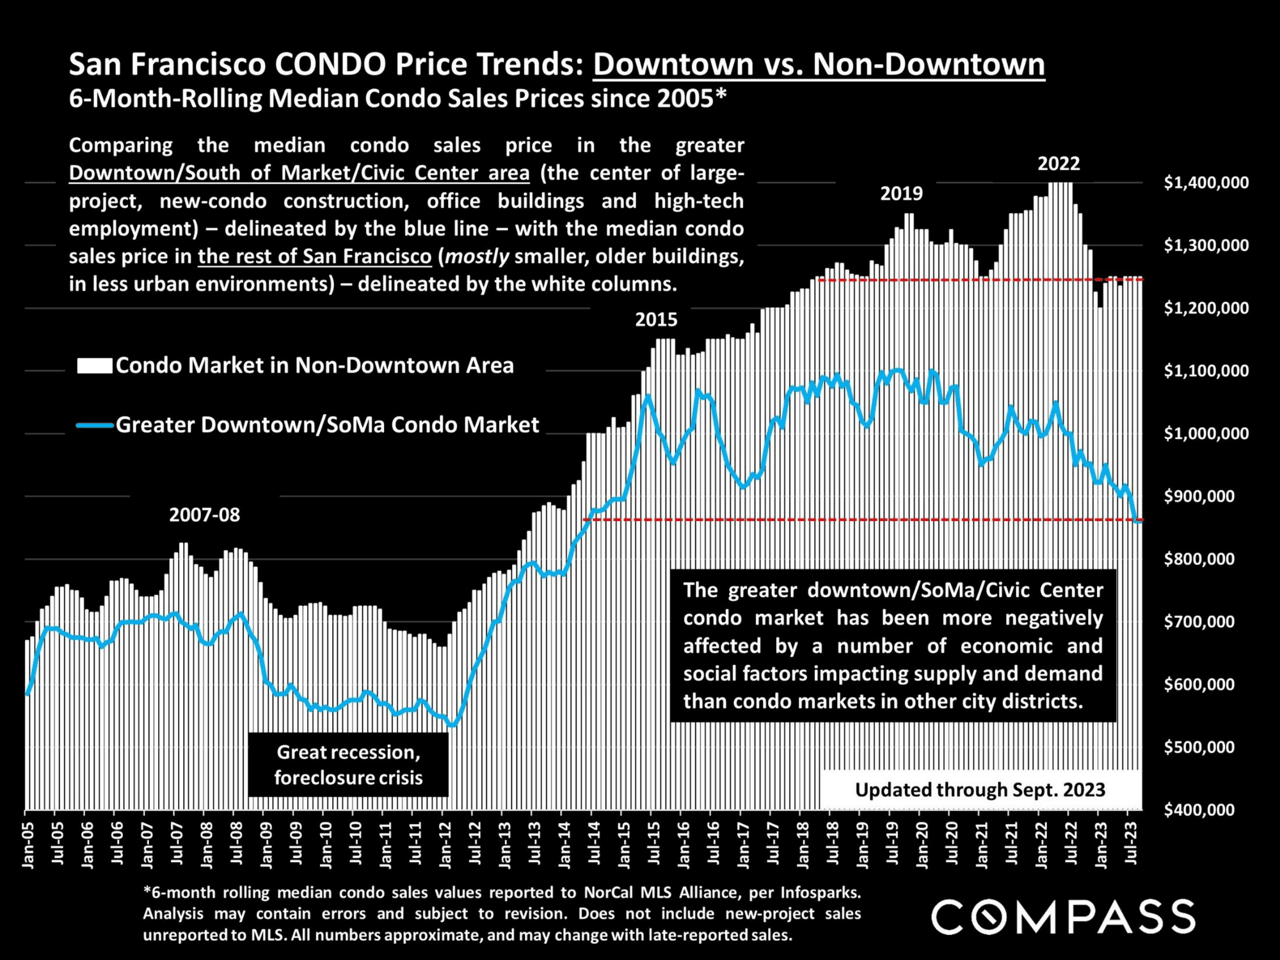
Chart comparing San Francisco downtown and non-downtown median condo prices from 2005 to 2023.
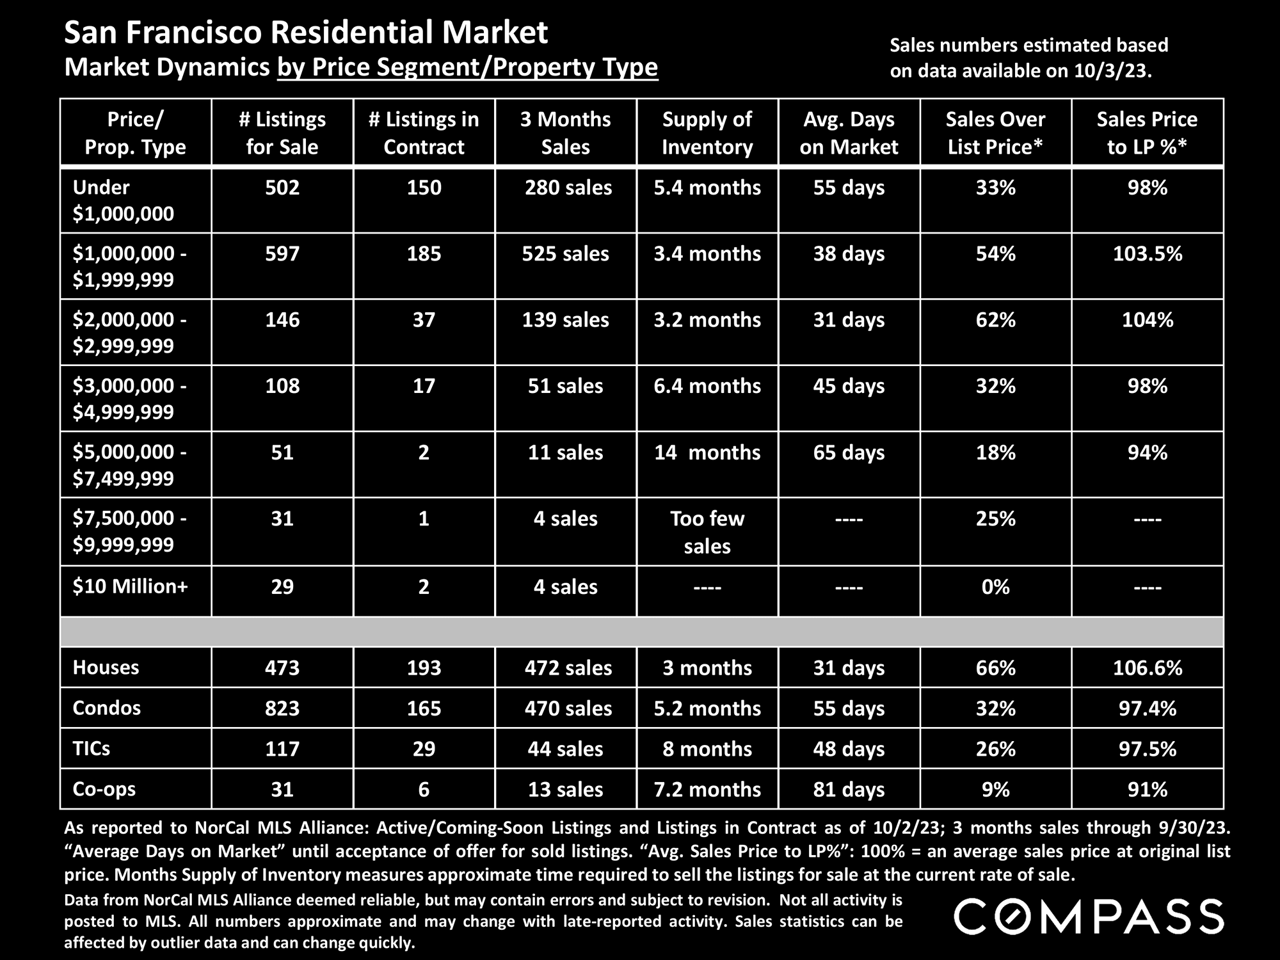
San Francisco residential market chart comparing sales and inventory metrics by price range and property type.
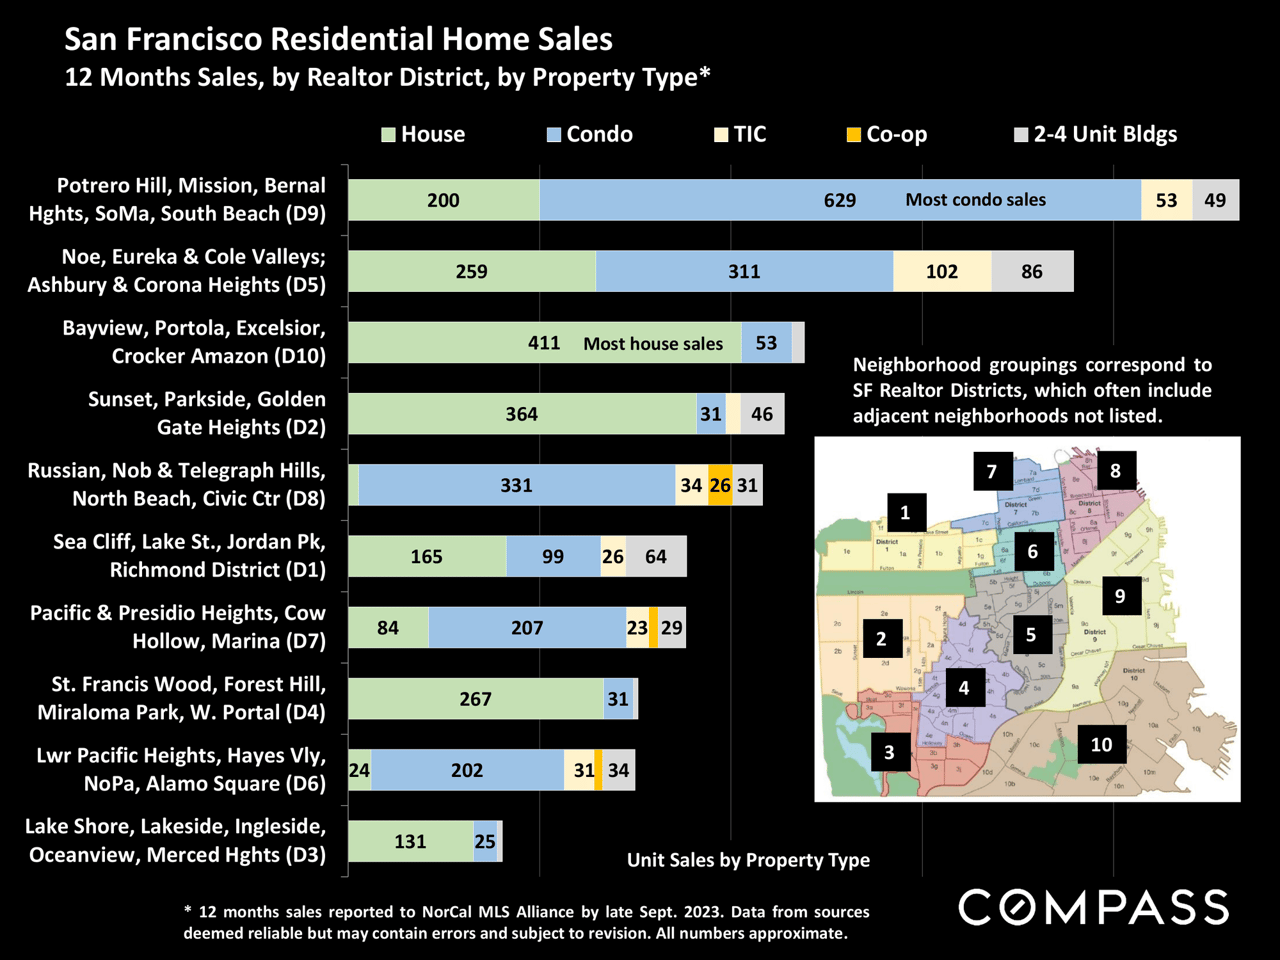
San Francisco home sales by Realtor district and property type, with a color-coded district map.
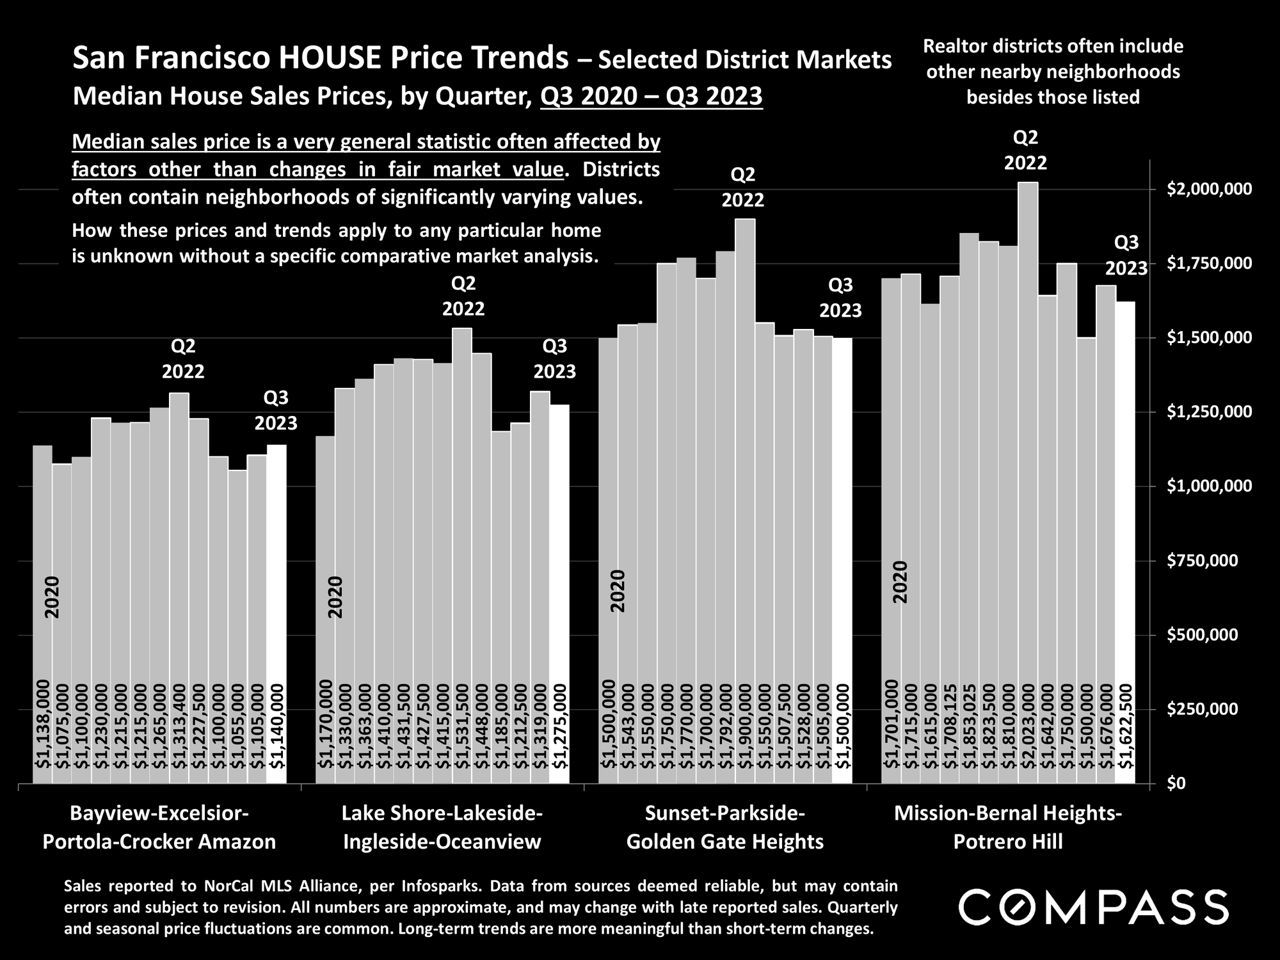
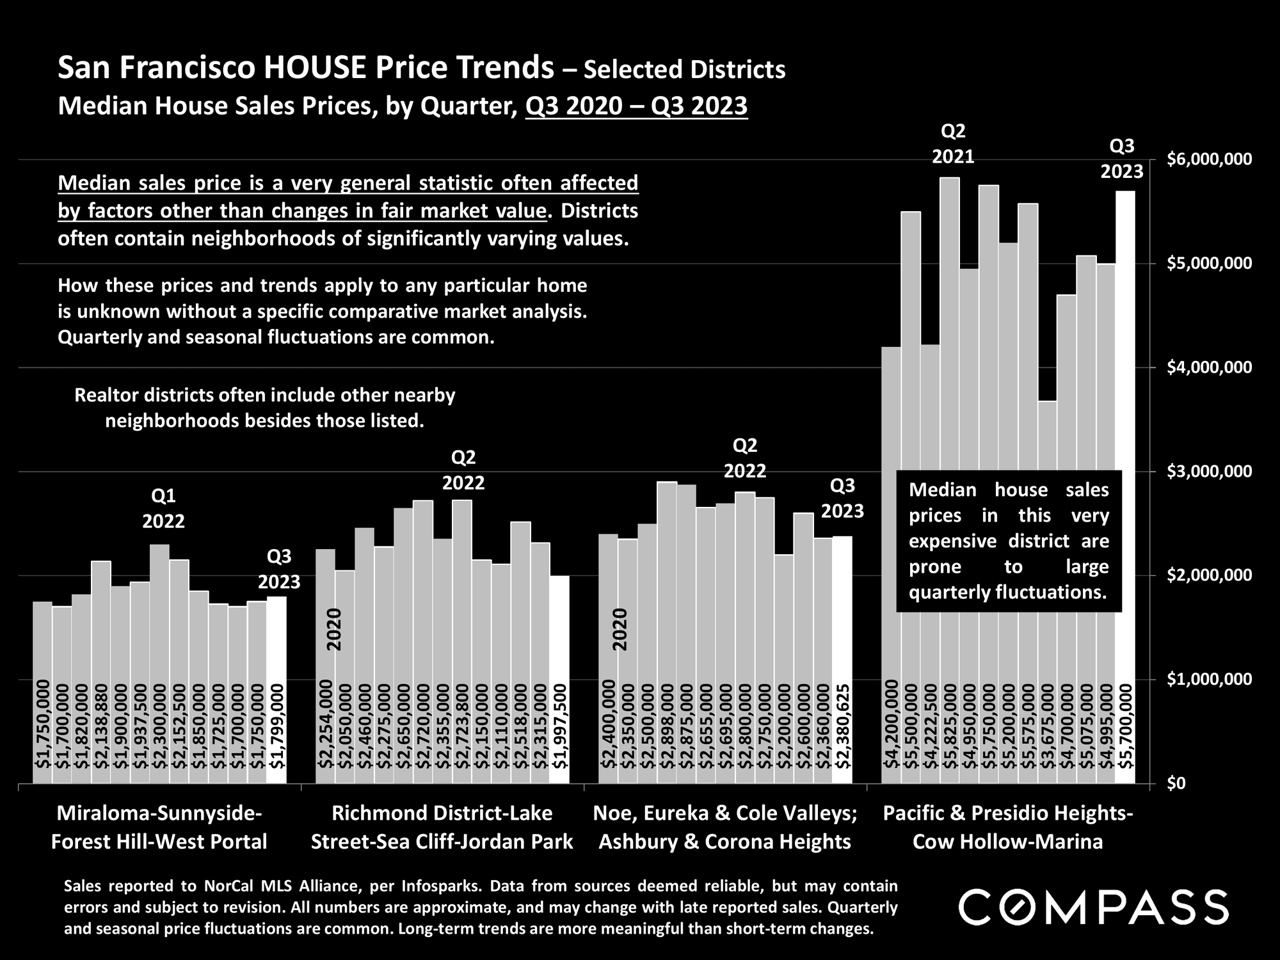
Bar chart of quarterly median house prices in four San Francisco district groups, from Q3 2020 to Q3 2023.
Bar chart comparing quarterly median house prices across four San Francisco district groups, Q3 2020–Q3 2023.
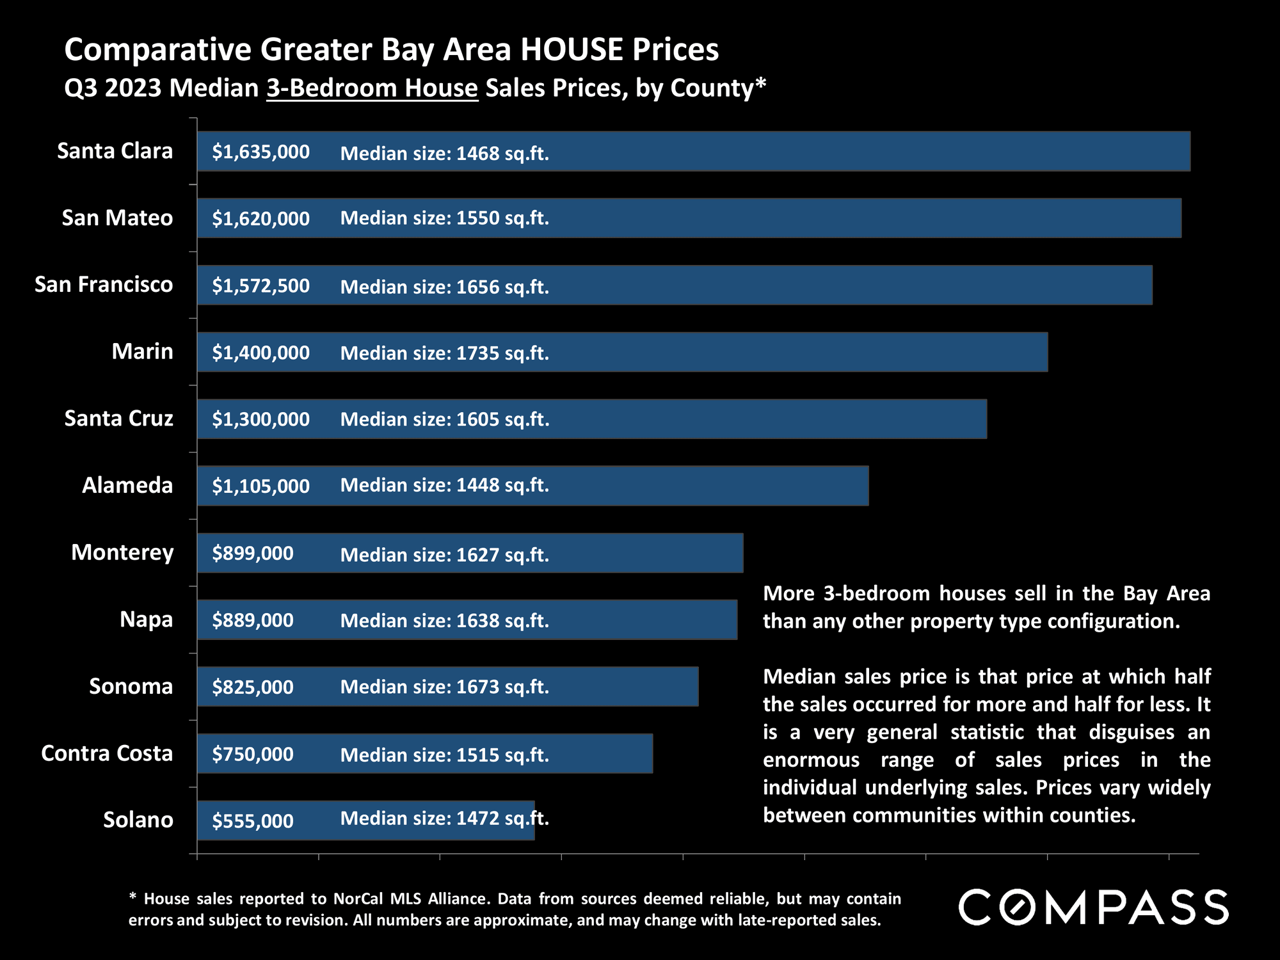
Bar chart comparing Q3 2023 median three-bedroom house prices and sizes across 11 Greater Bay Area counties.
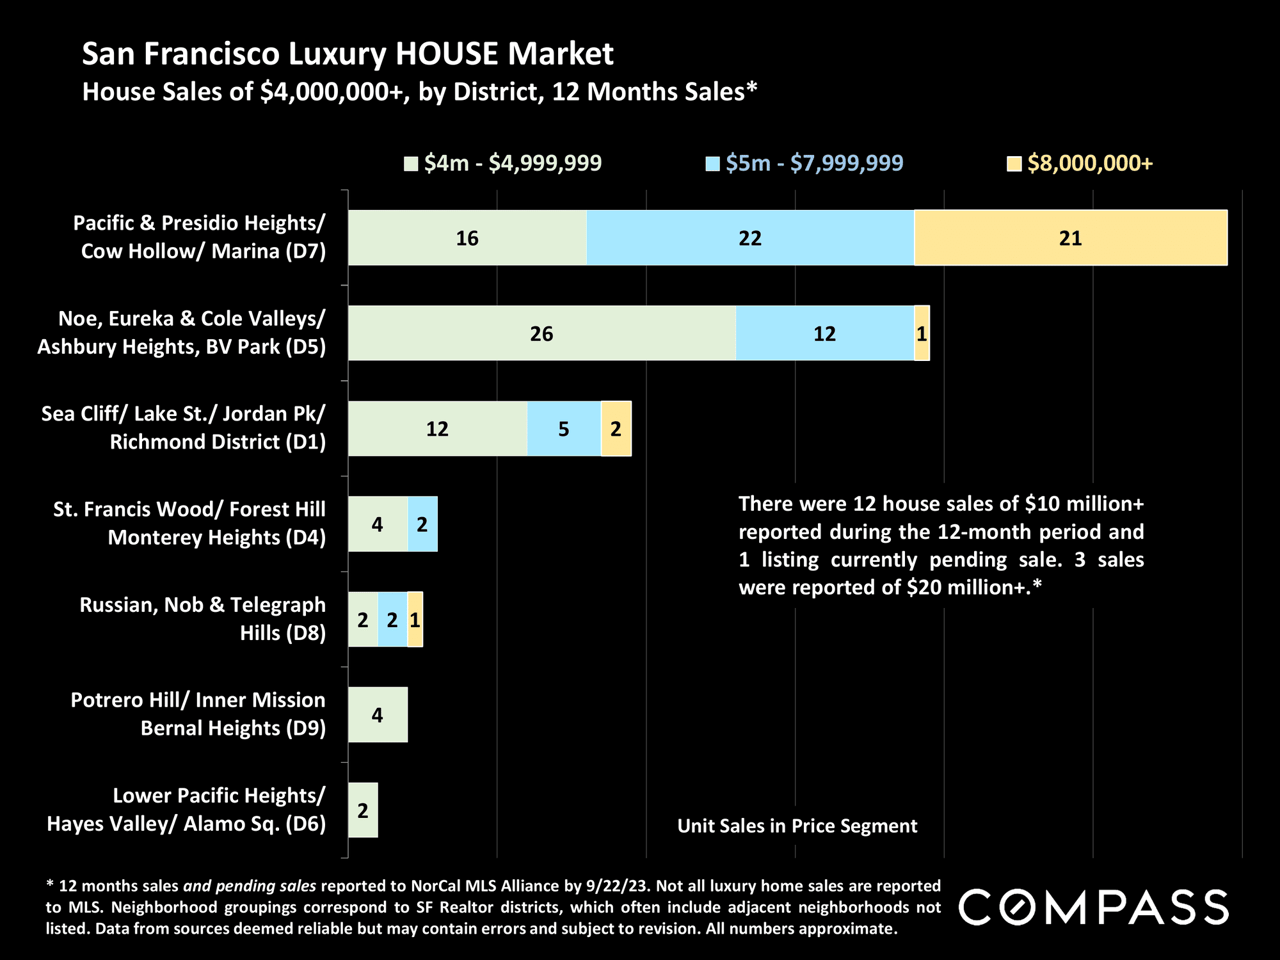
Bar chart of San Francisco luxury home sales by district and price segment, with the most sales in the $4 million range.
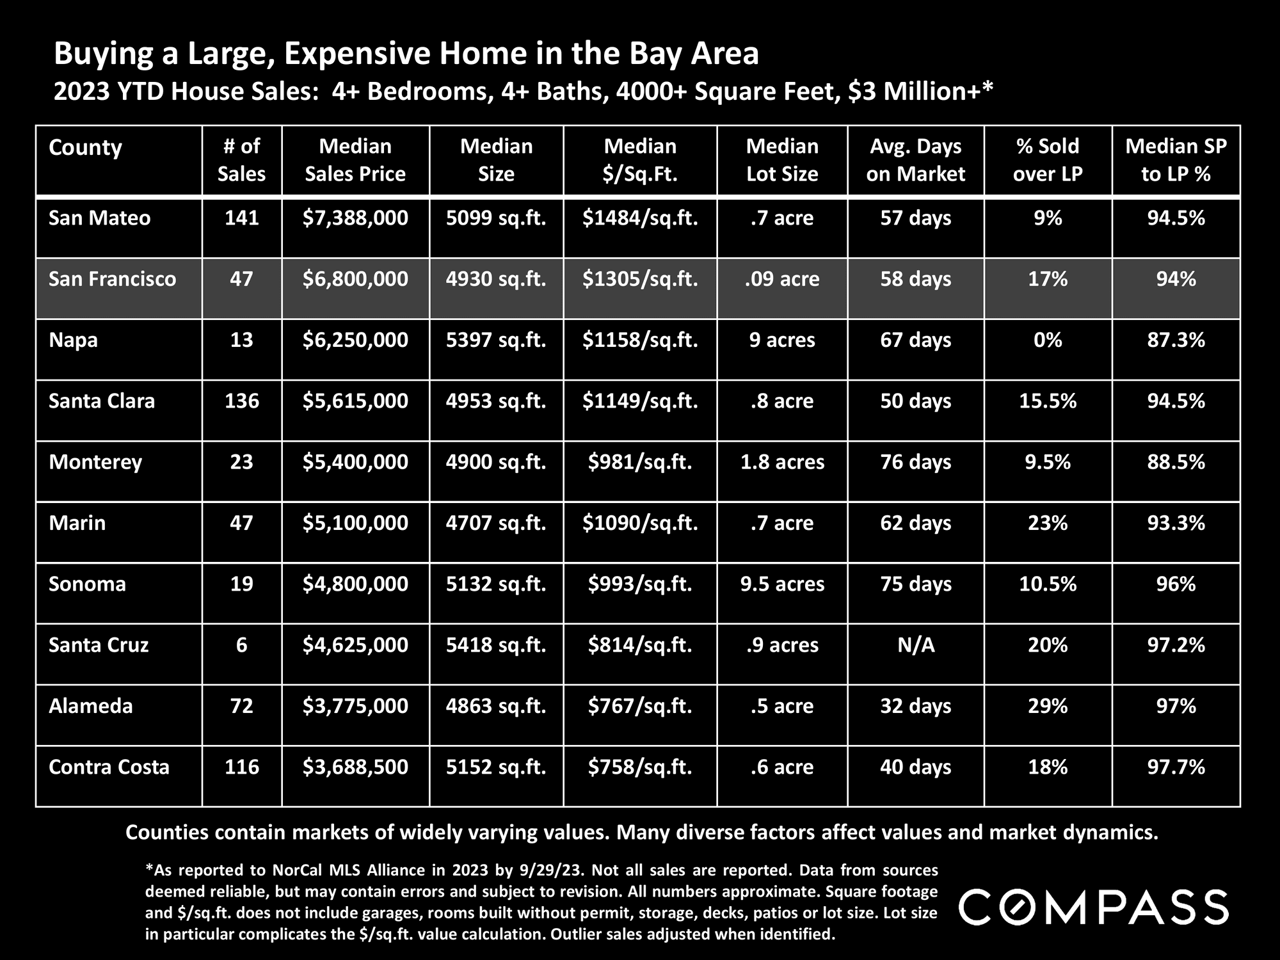
Bay Area luxury home sales table comparing prices, sizes, and market trends across ten counties.
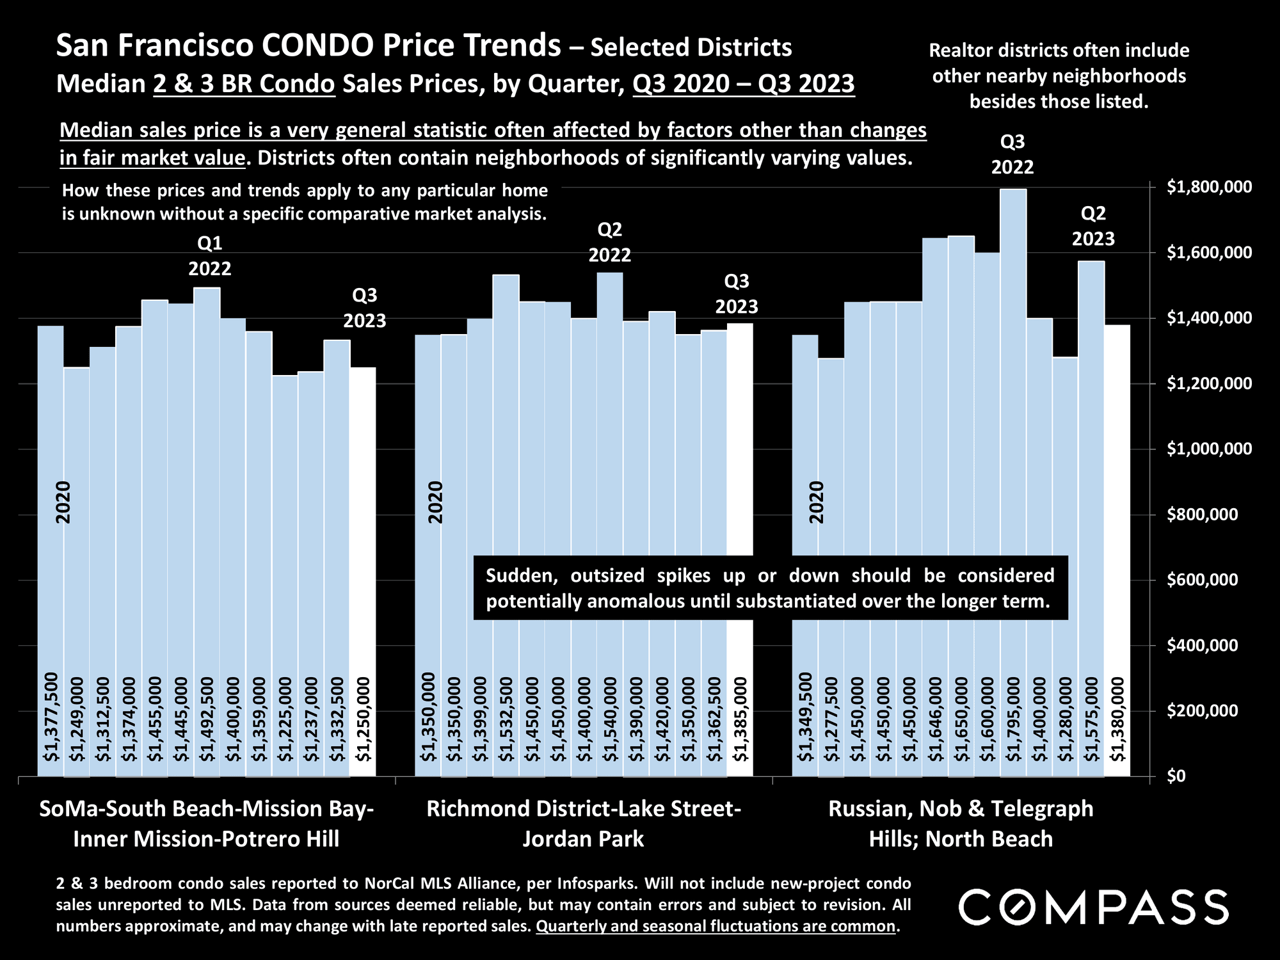
Bar chart comparing quarterly median two- and three-bedroom condo prices across selected San Francisco districts, Q3 2020–Q3 2023.
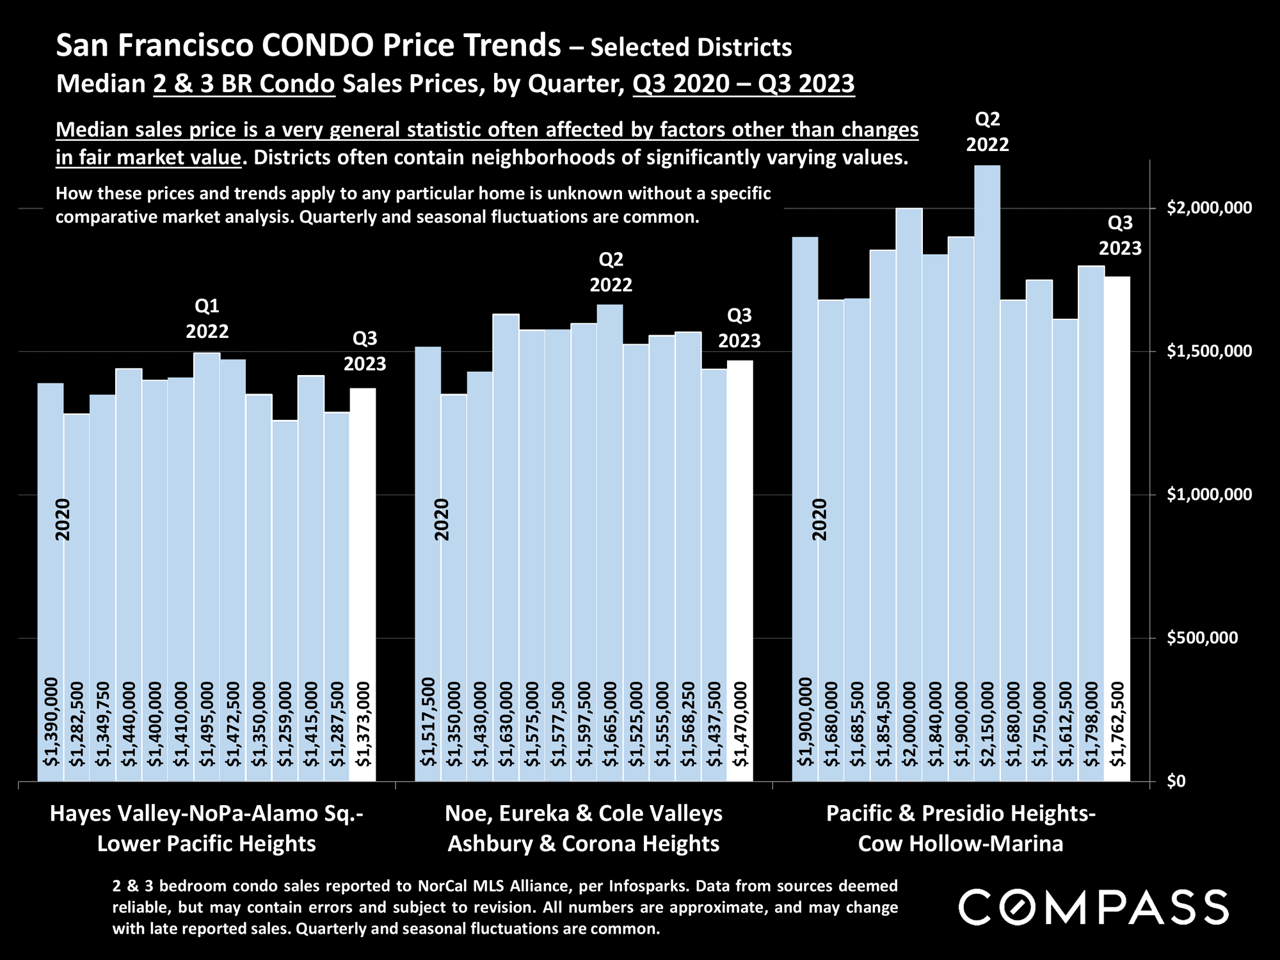
Bar chart comparing quarterly two- and three-bedroom condo sale prices across three San Francisco district groups.
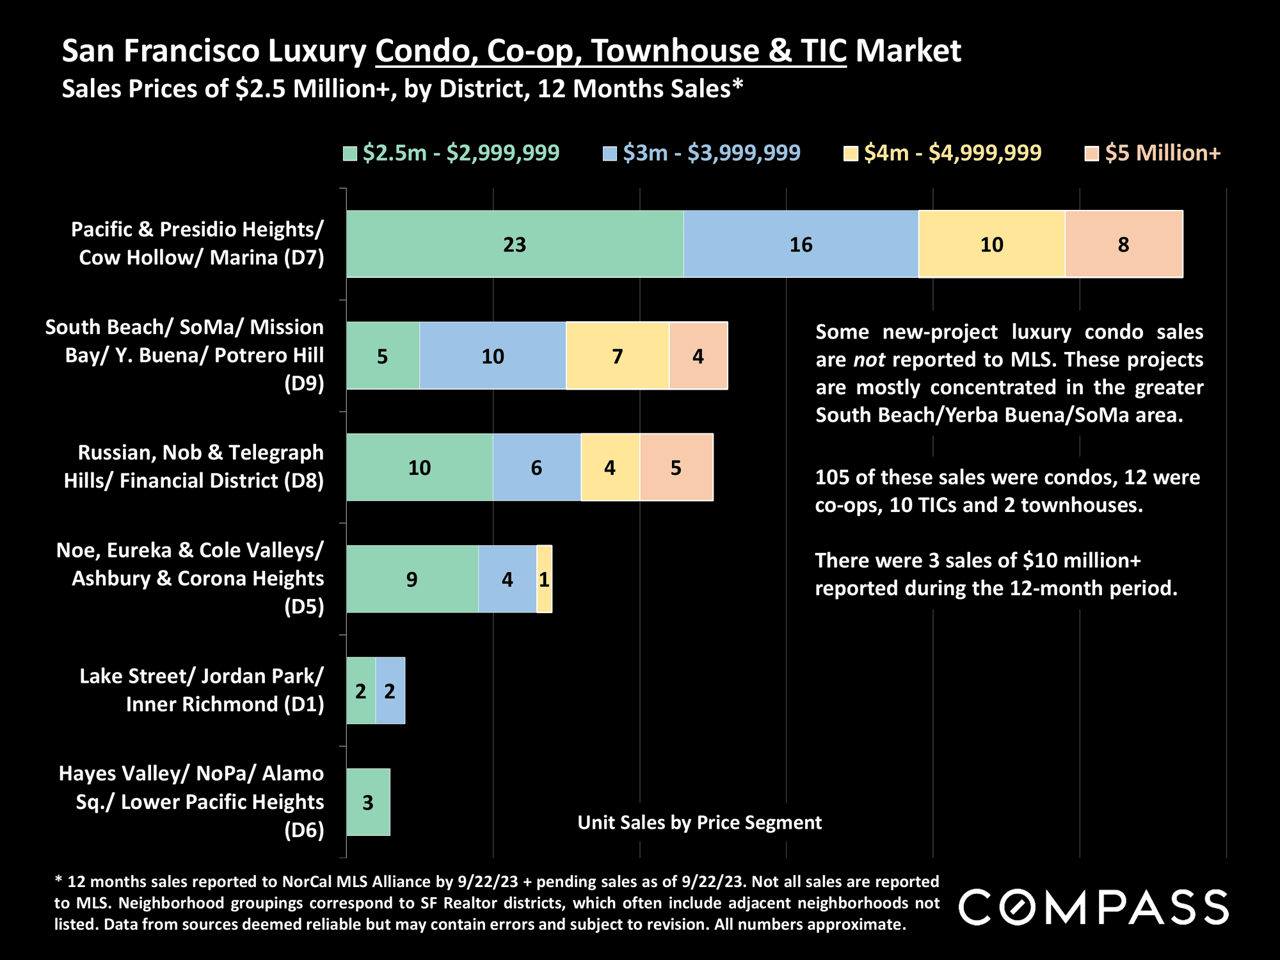
San Francisco luxury home sales by district and price segment, with notes on unreported sales and property types.
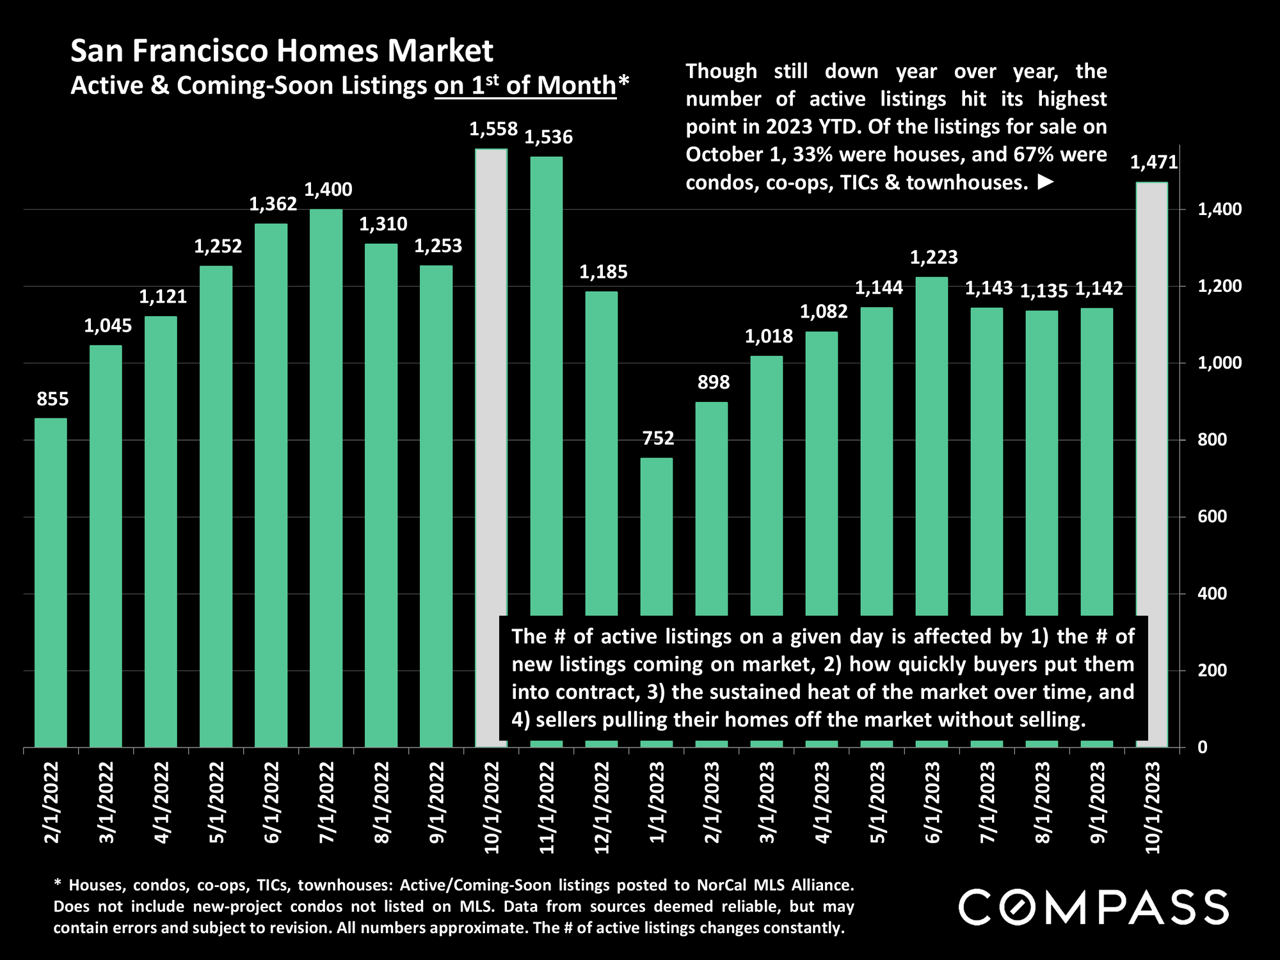
Bar chart of San Francisco active and coming-soon listings, peaking at 1,558 in October 2022 and reaching 1,471 in October 2023.
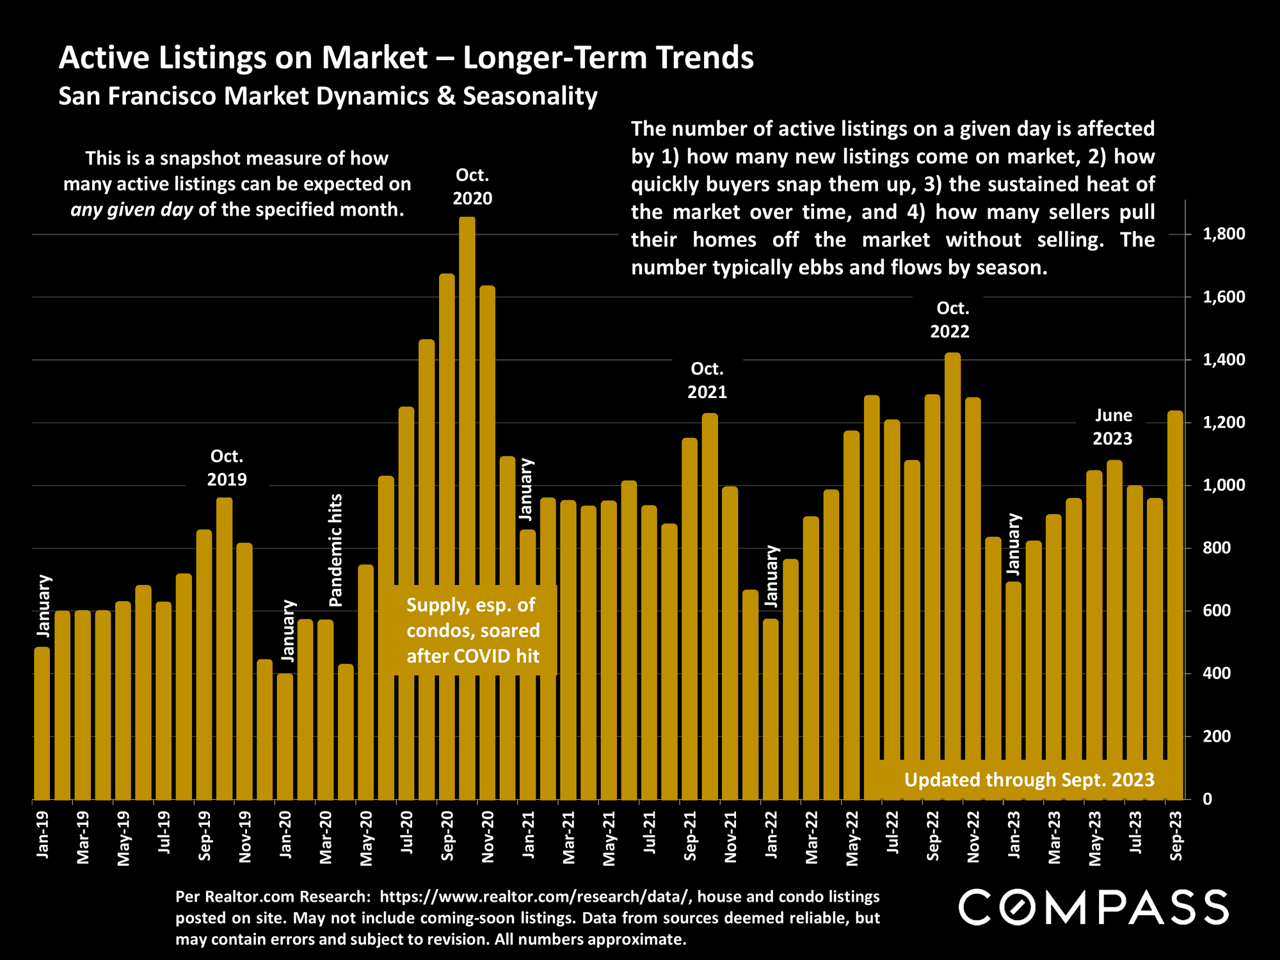
Bar chart of San Francisco active listings from January 2019 to September 2023, with seasonal trends and a late-2020 peak.
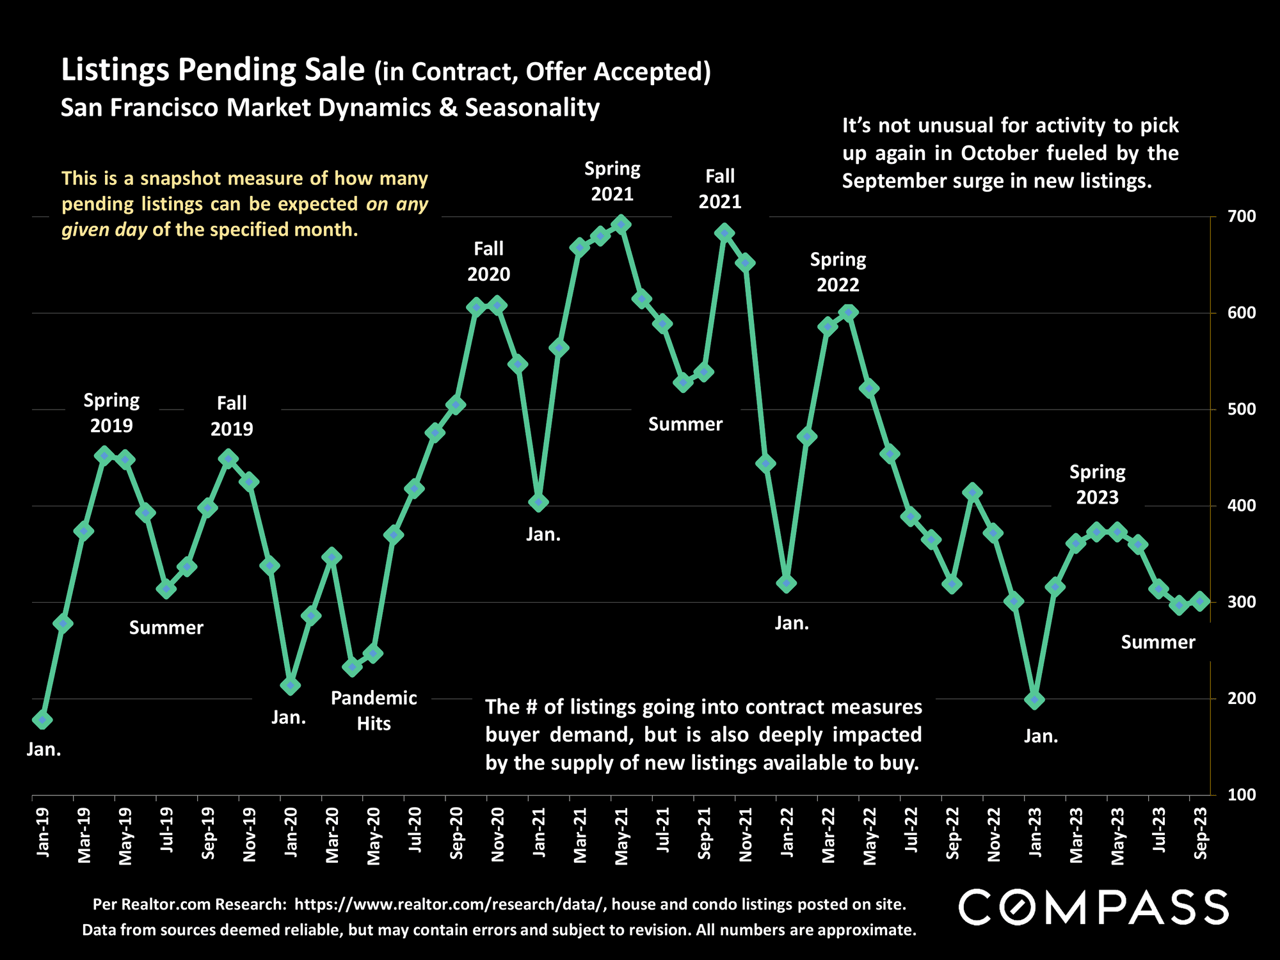
Chart of San Francisco pending listings, peaking in spring 2021 and declining through September 2023.
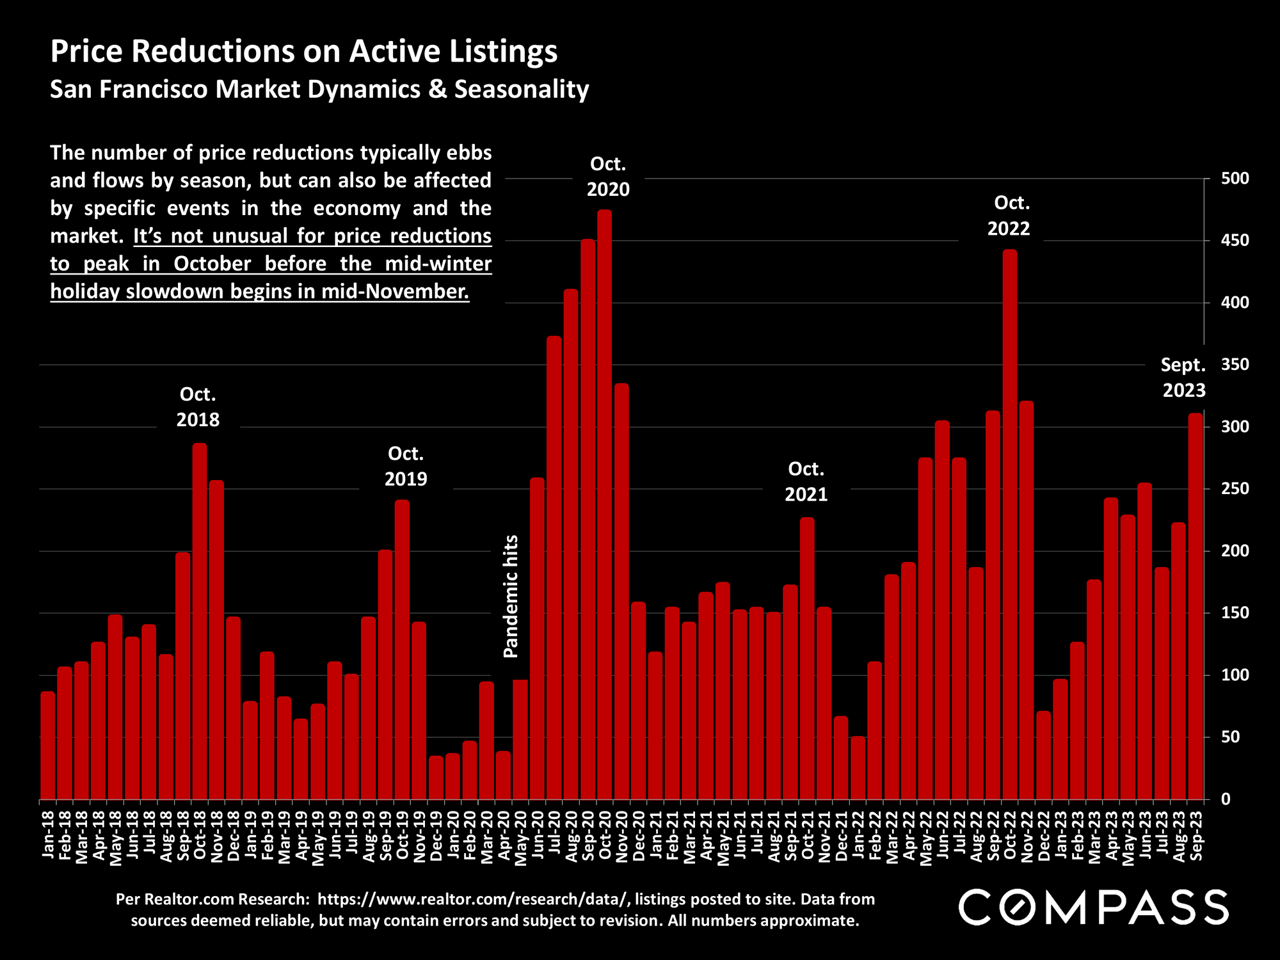
Chart of San Francisco active-listing price reductions, with monthly red bars from 2018 to 2023 and October peaks marked.
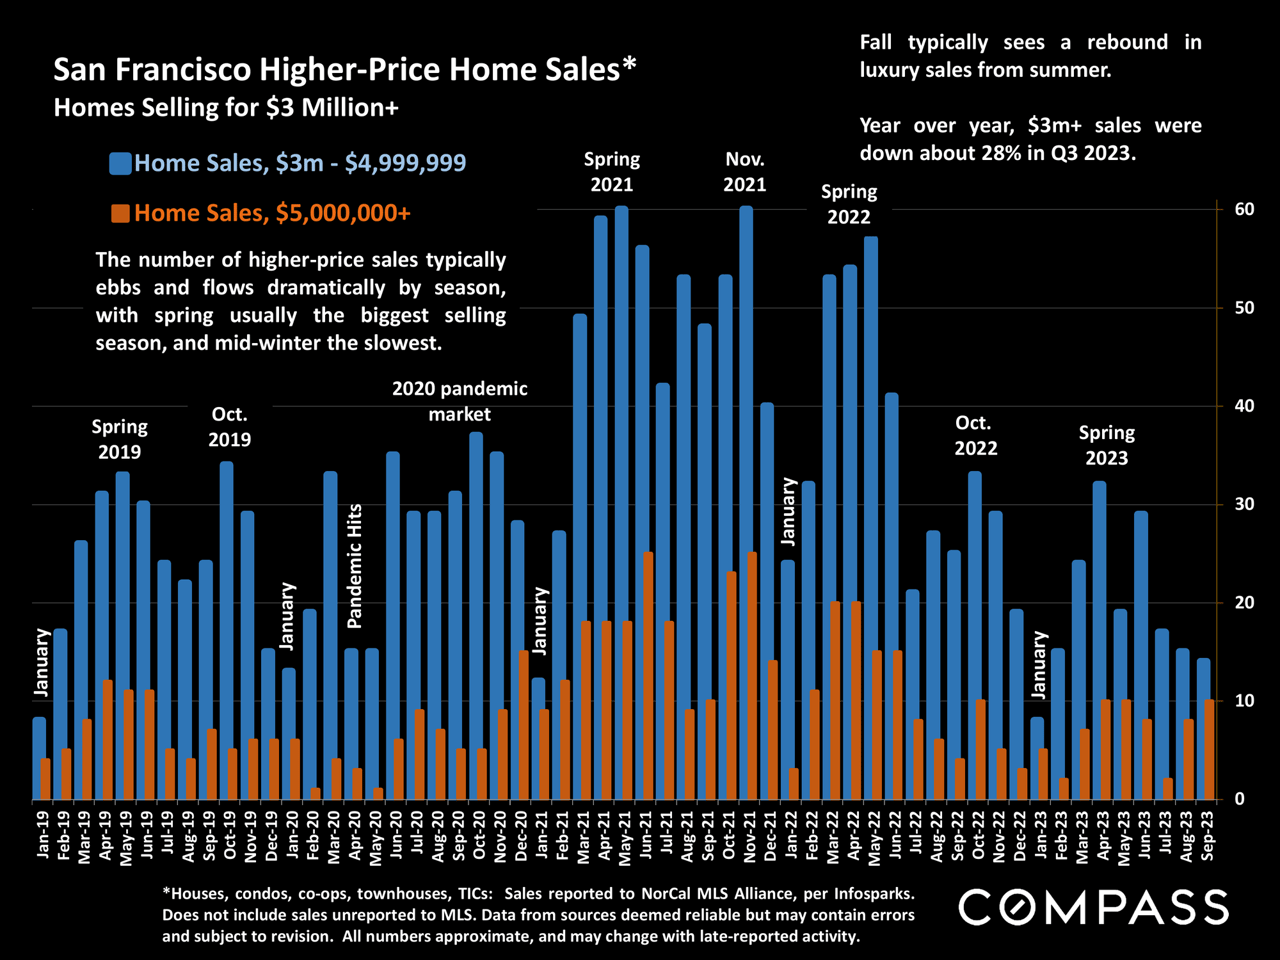
Chart of monthly San Francisco sales above $3 million, with separate bars for $3–5 million and $5 million-plus homes.
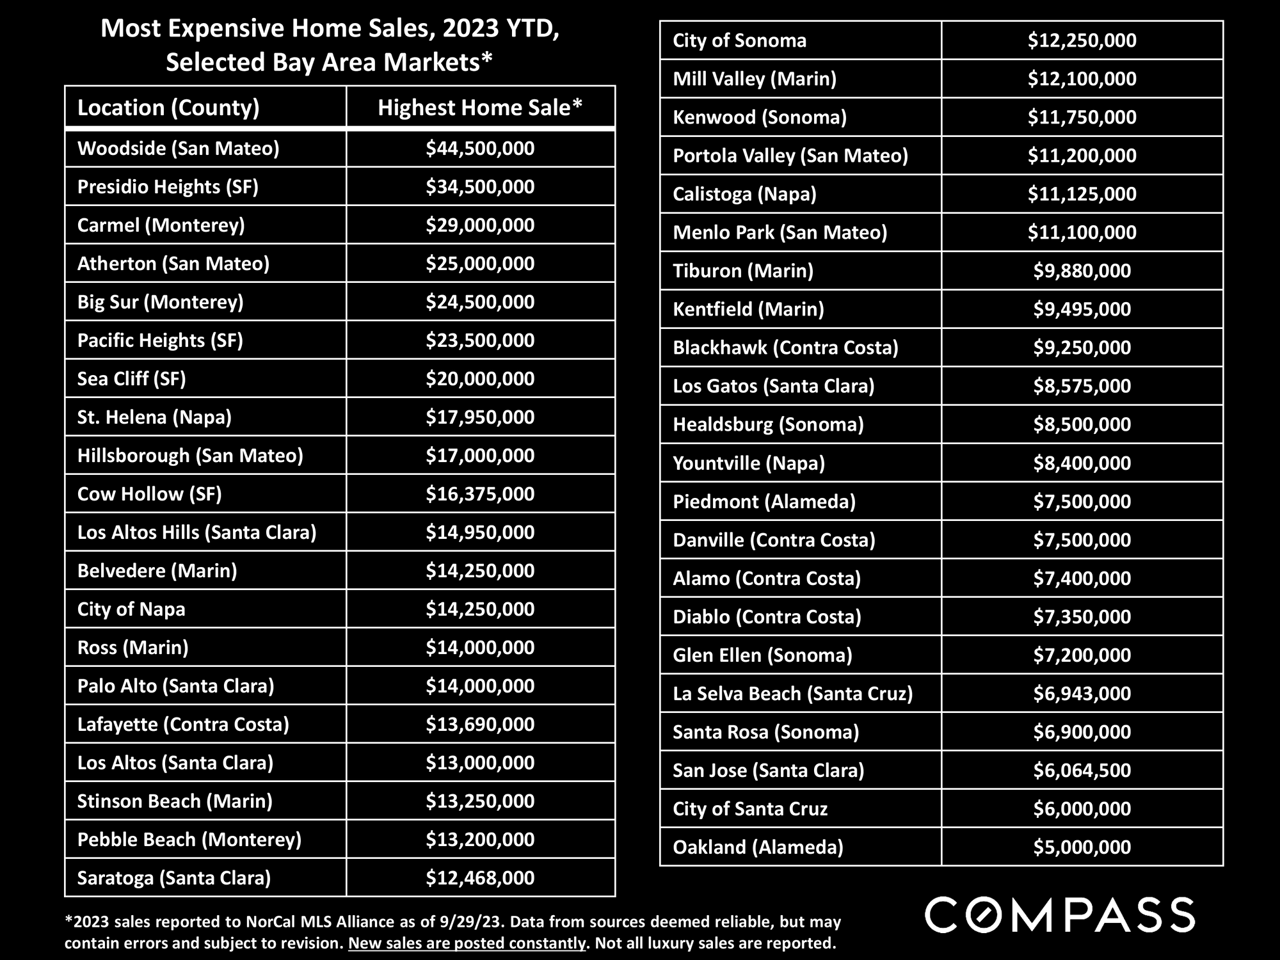
Infographic ranking 2023 year-to-date highest home sales across selected Bay Area markets, led by Woodside at $44.5 million.
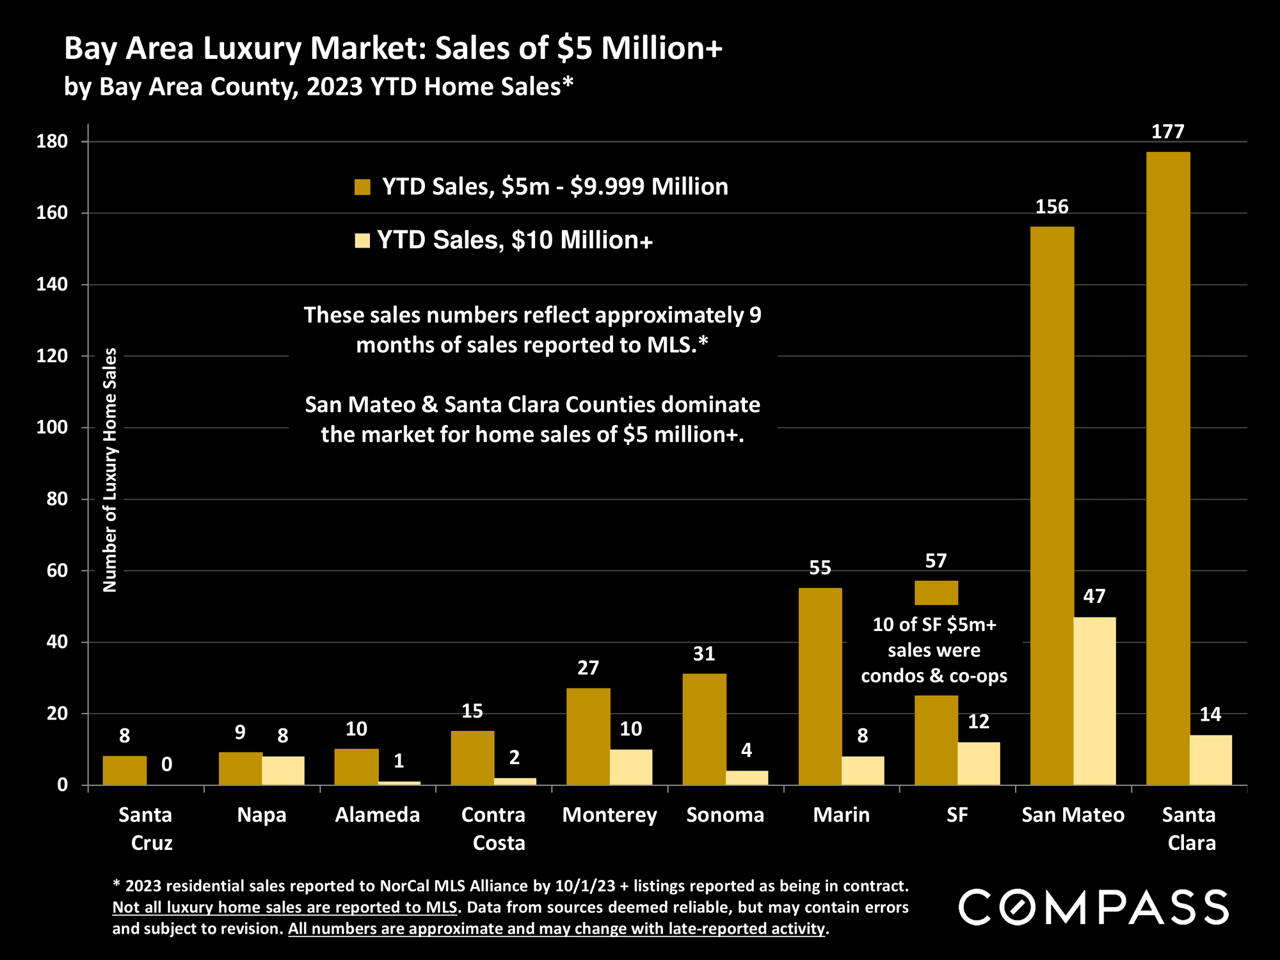
Bar chart comparing Bay Area counties’ 2023 year-to-date home sales over $5 million; Santa Clara leads with 177 sales.
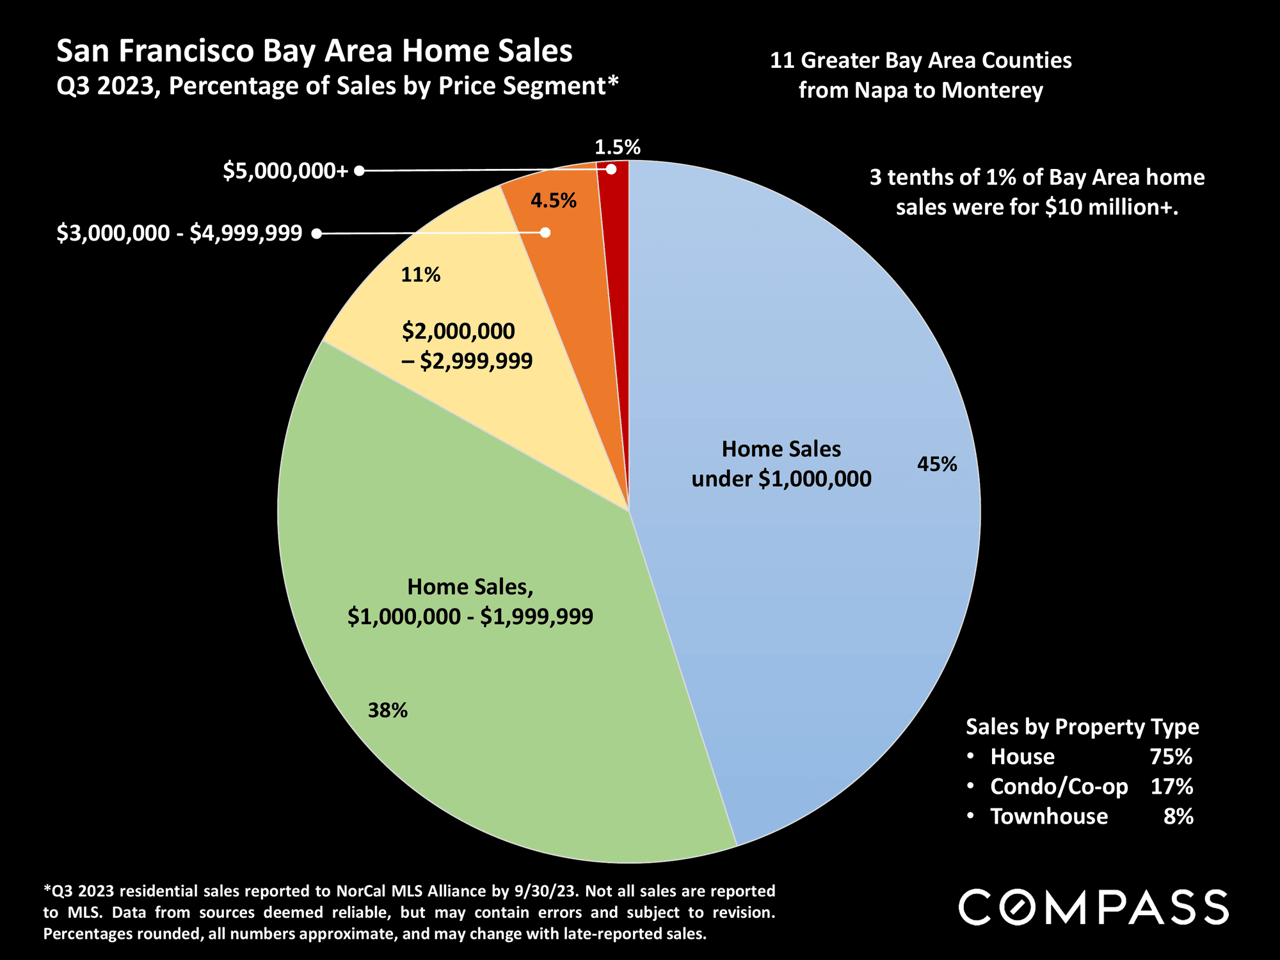
Q3 2023 Bay Area home sales by price segment, shown in a pie chart, with property-type percentages and Compass branding.
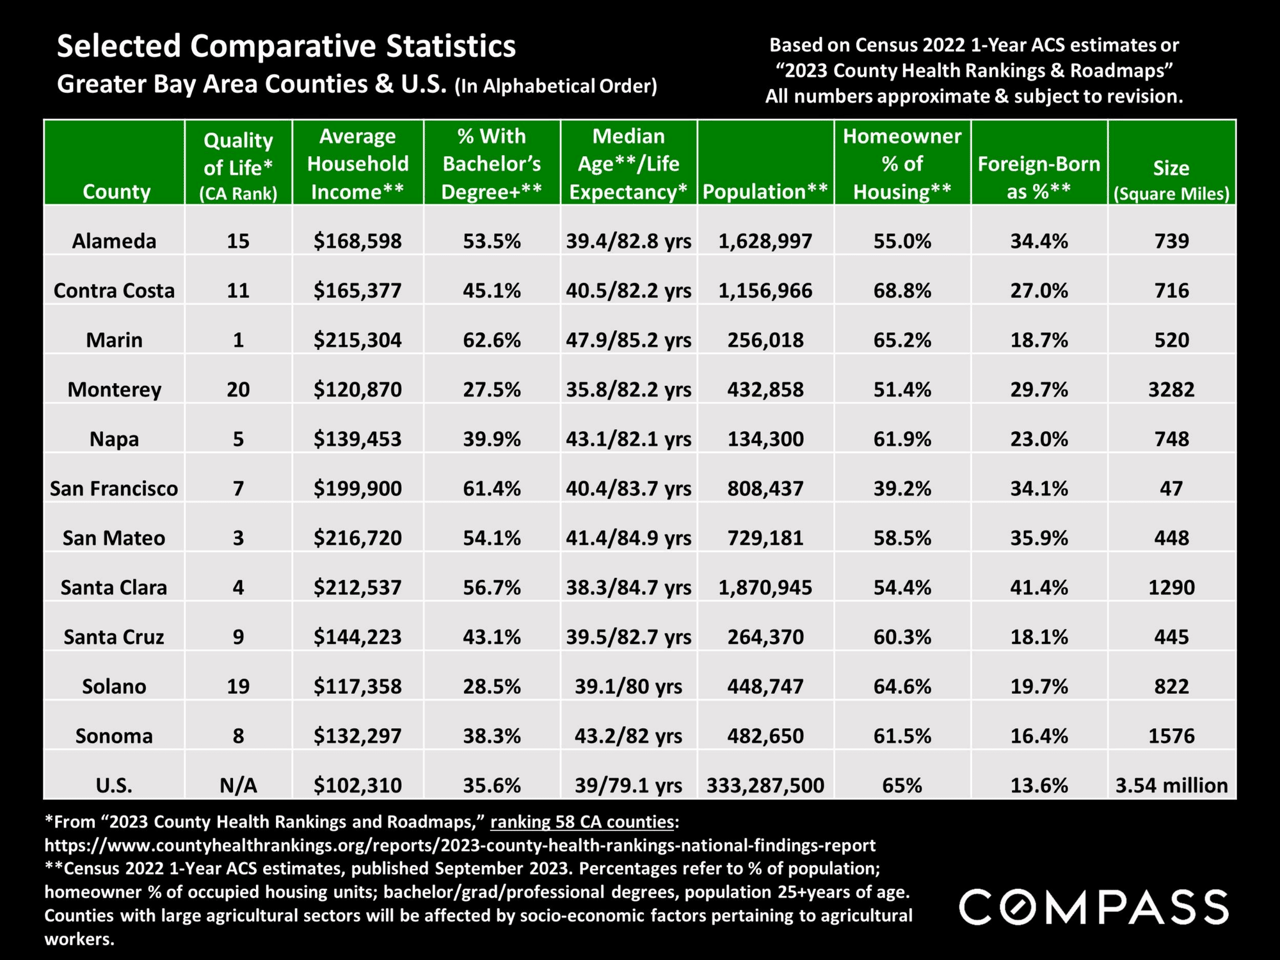
Table comparing socioeconomic and demographic statistics for Greater Bay Area counties and the United States.
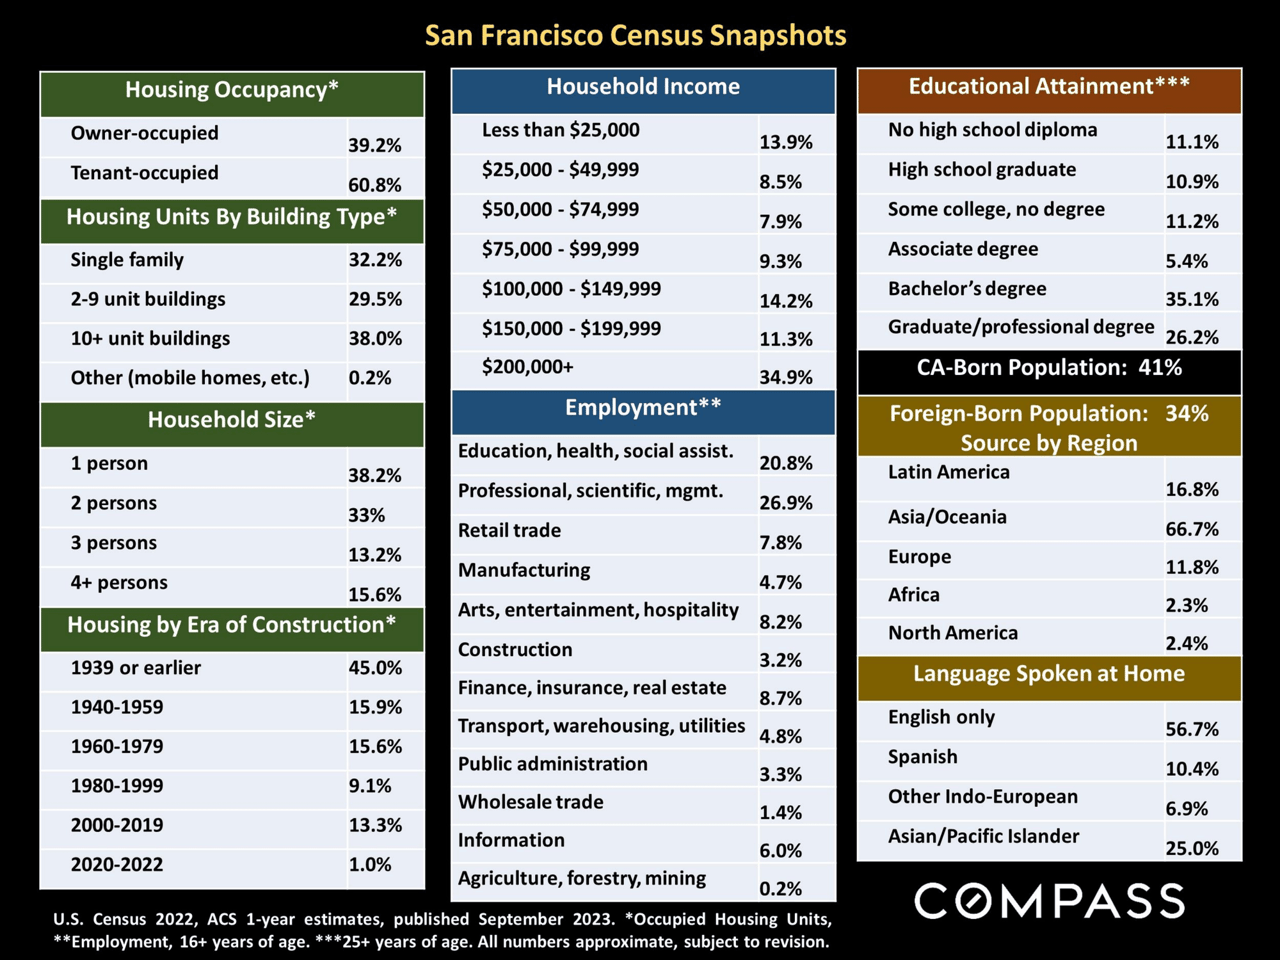
San Francisco census infographic showing housing, income, employment, education, birthplace, and language statistics.
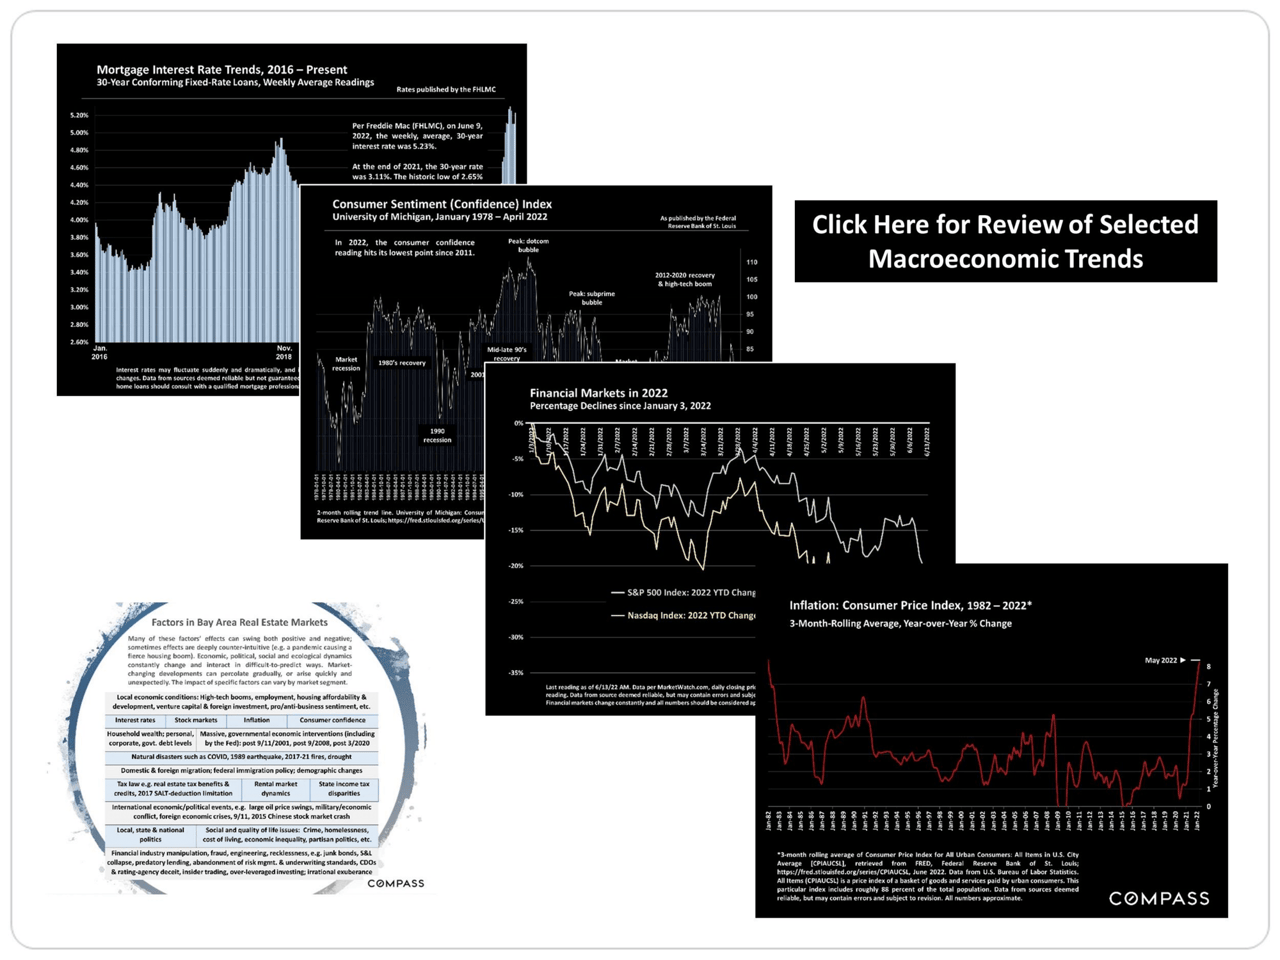
Macroeconomic charts on mortgage rates, consumer sentiment, financial markets, inflation, and Bay Area real estate factors.
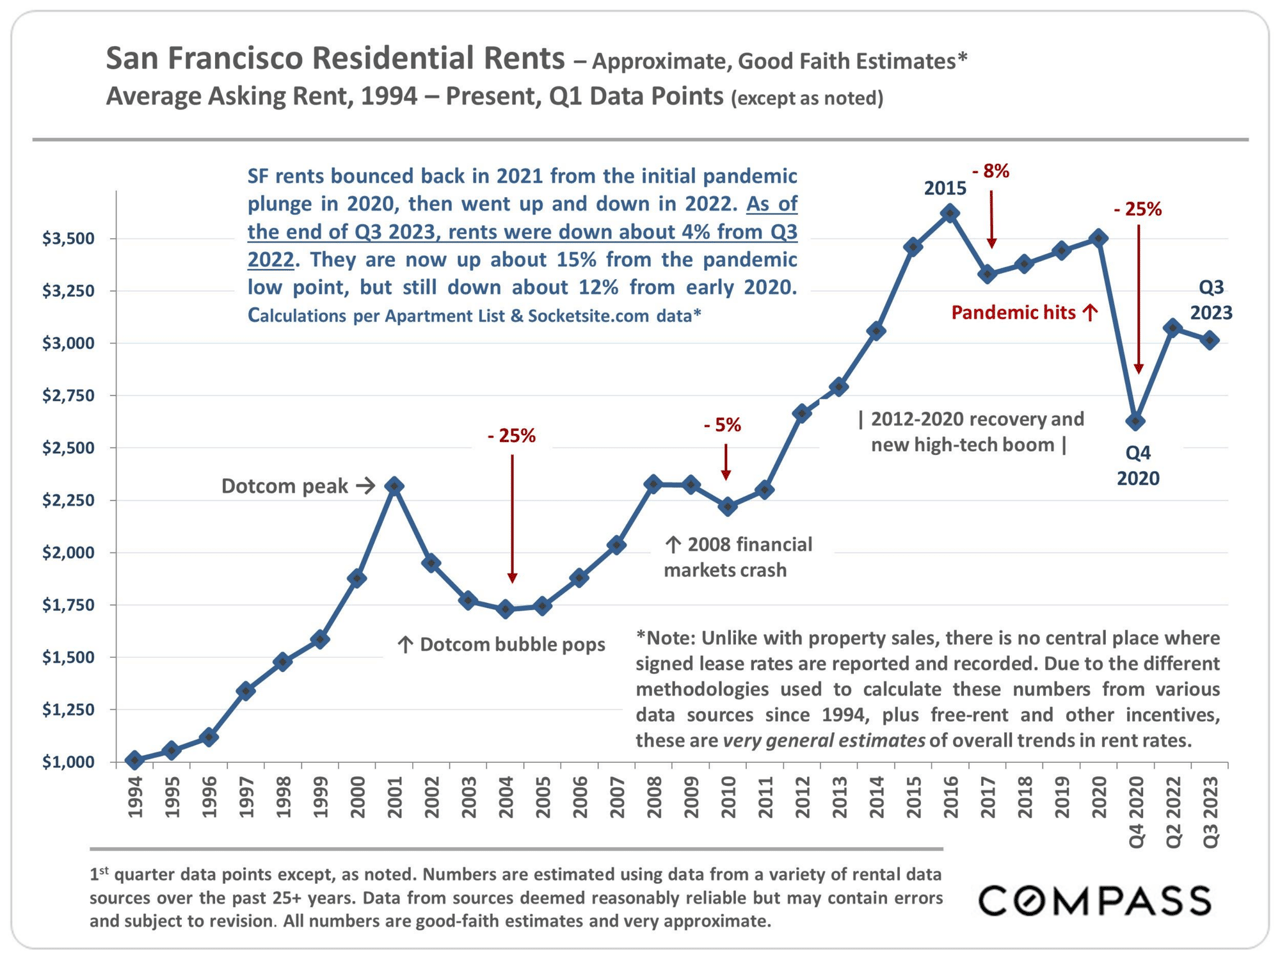
Chart of San Francisco average asking rents from 1994 through Q3 2023, with historical rent trends and market annotations.
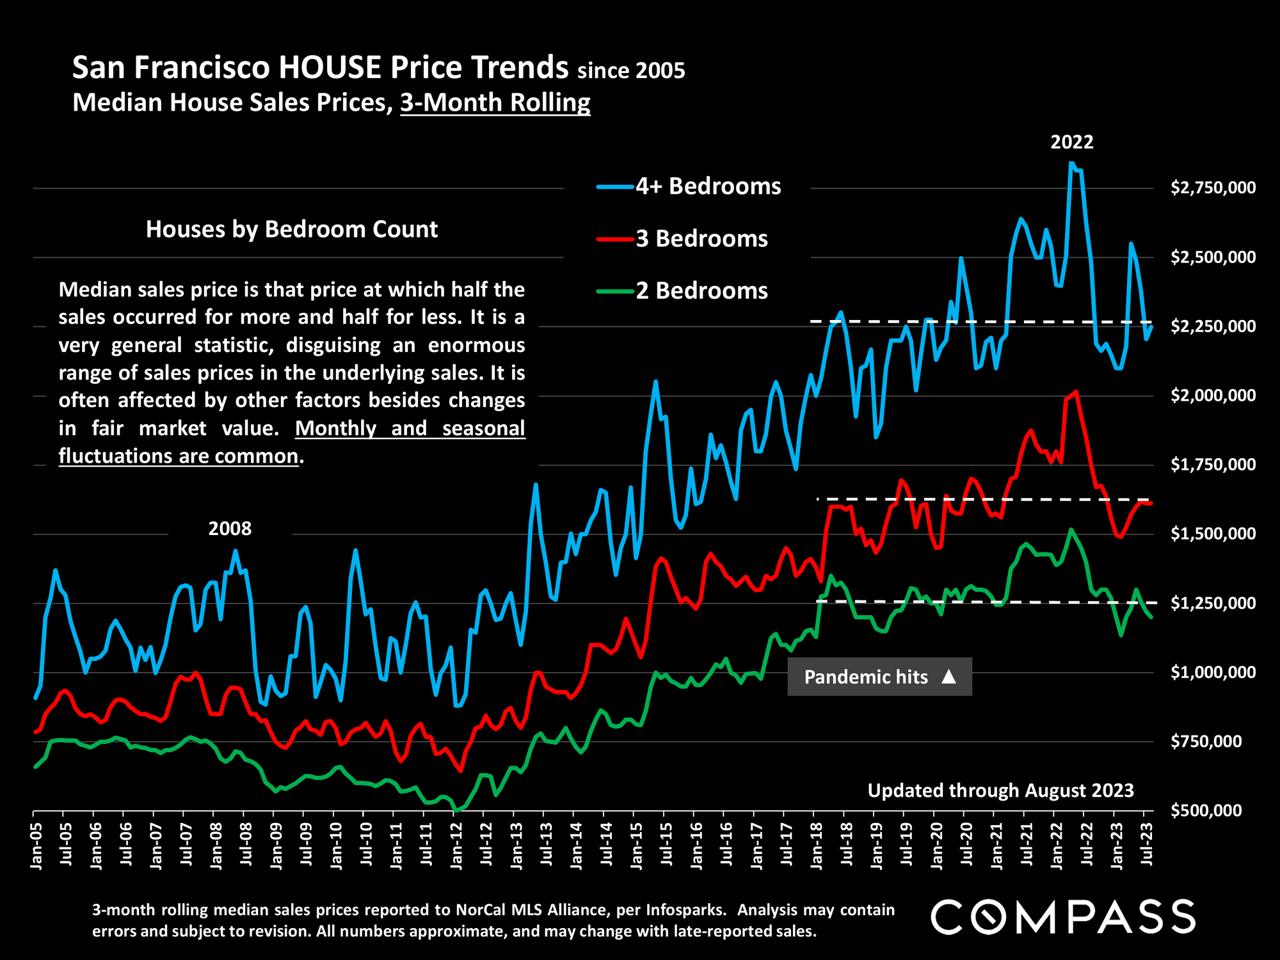
Chart of San Francisco rolling median house prices by bedroom count from 2005 to 2023.
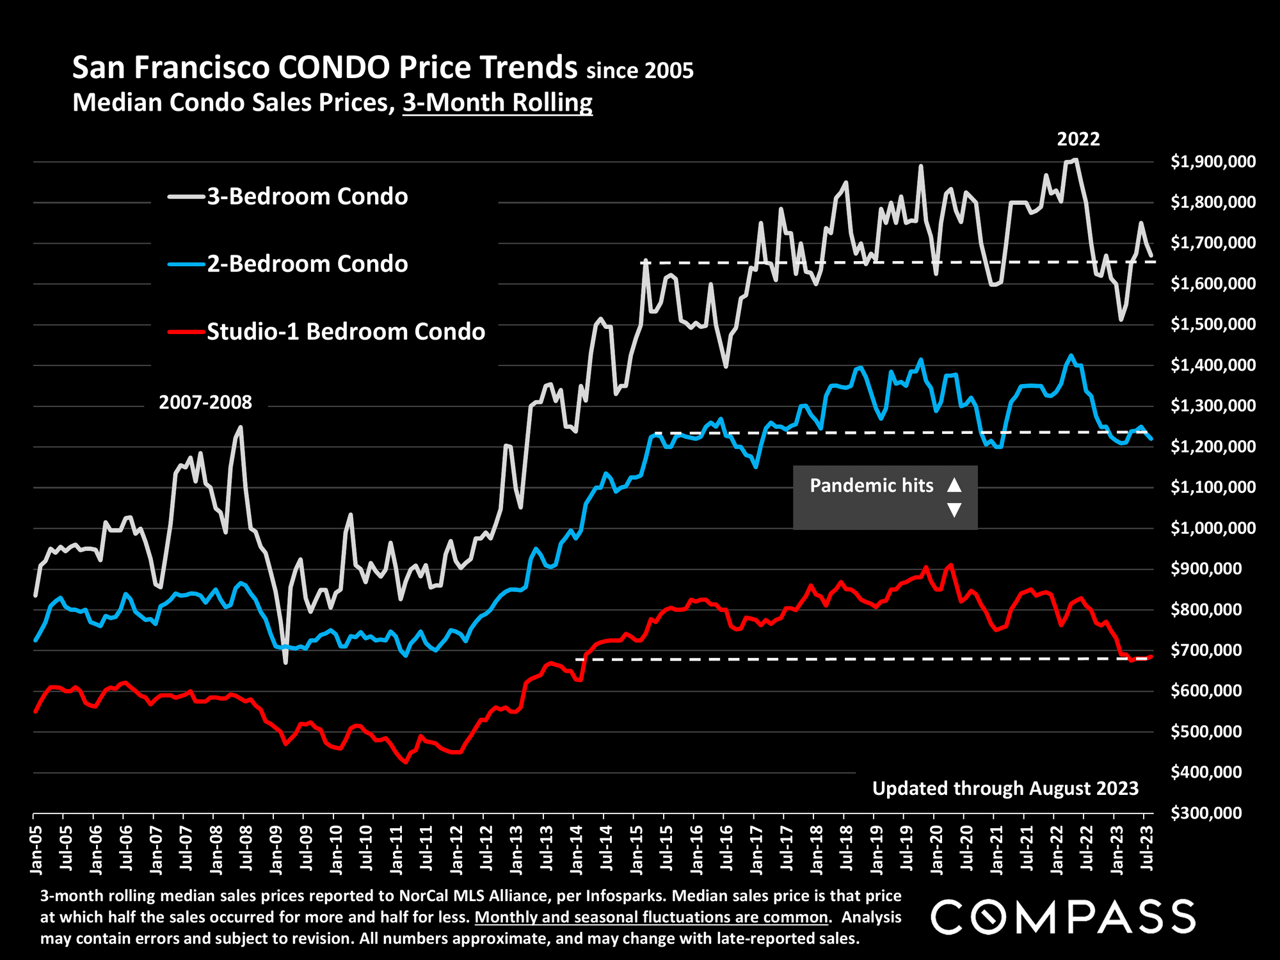
San Francisco condo price trends, 2005–2023, charted by bedroom count with a pandemic marker.
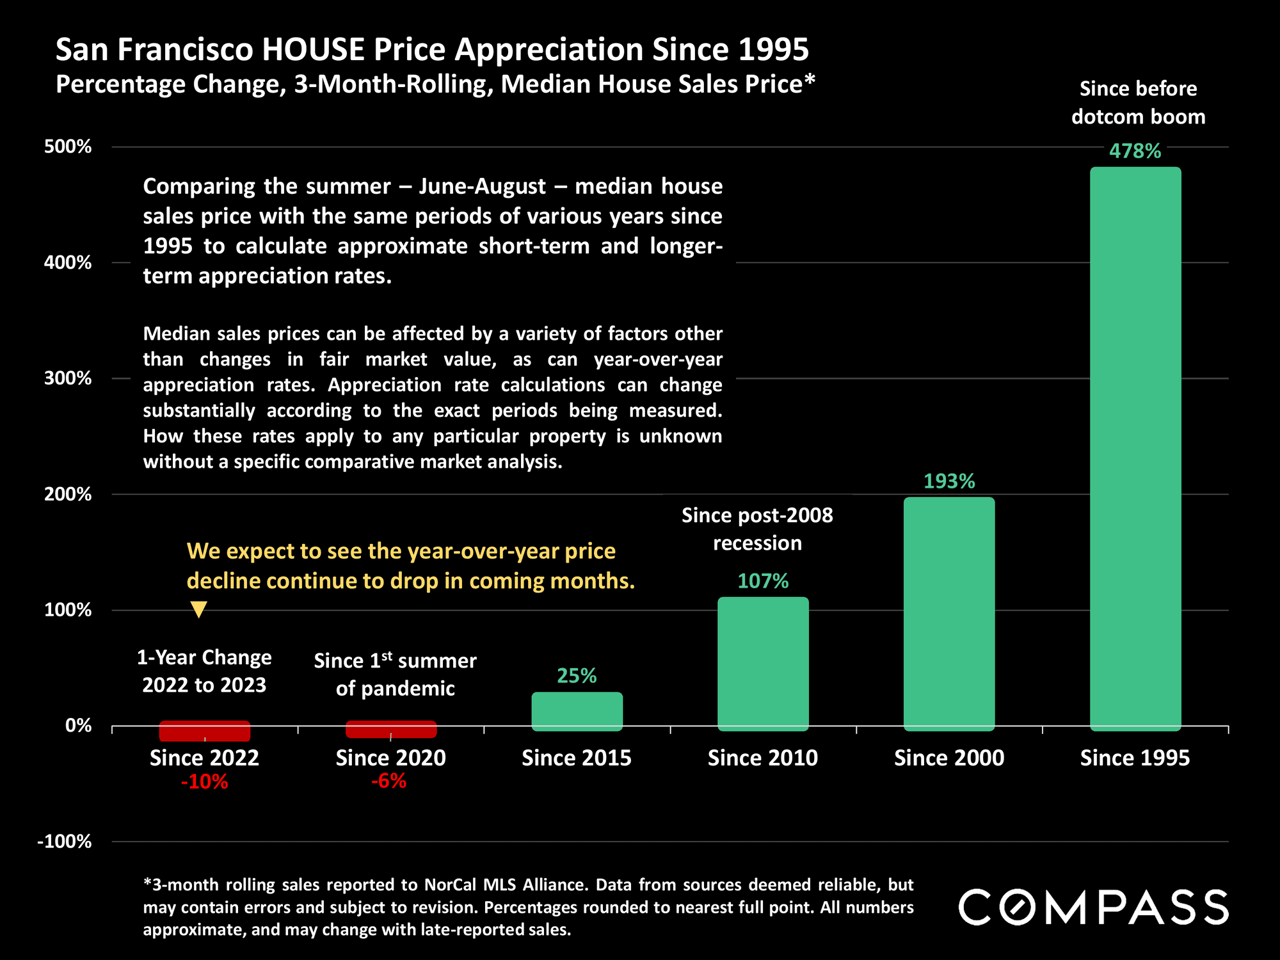
San Francisco house prices: 10% decline in 2022–23, versus 478% appreciation since 1995.
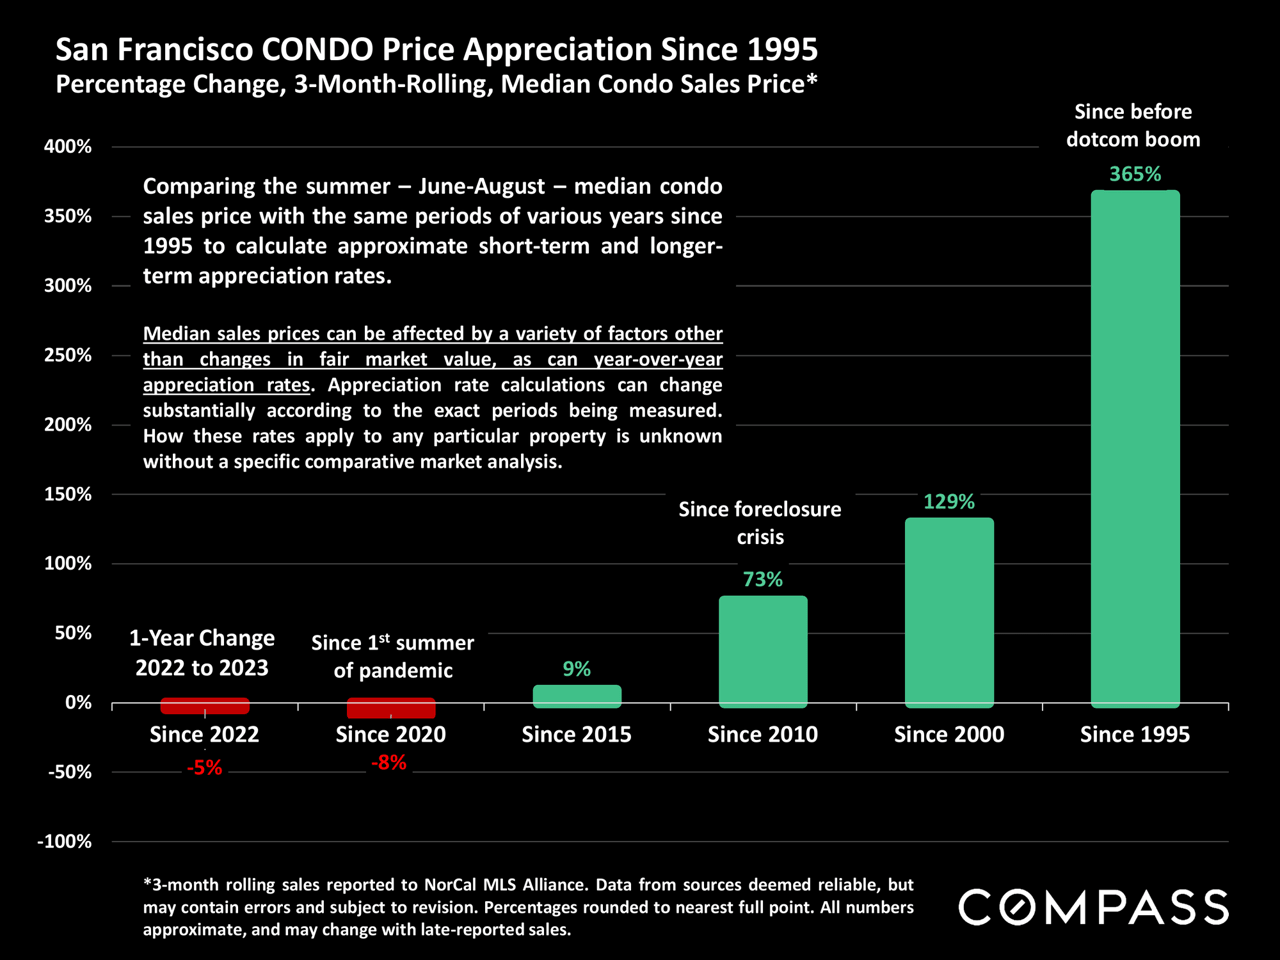
Chart of San Francisco condo price appreciation, showing declines since 2020 and long-term gains up to 365% since 1995.
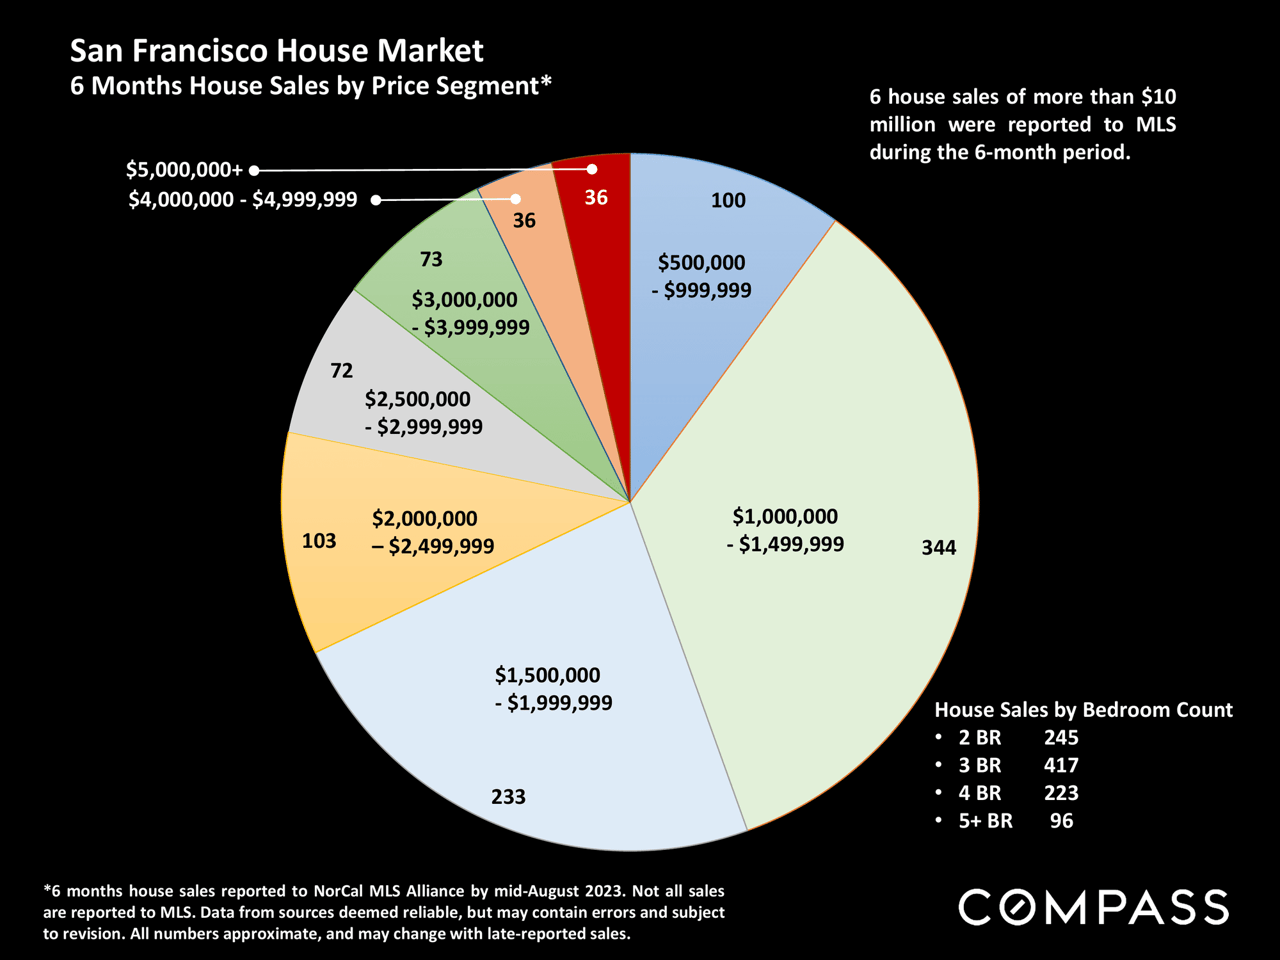
San Francisco house sales pie chart by price segment, with bedroom-count totals and a note on sales over $10 million.
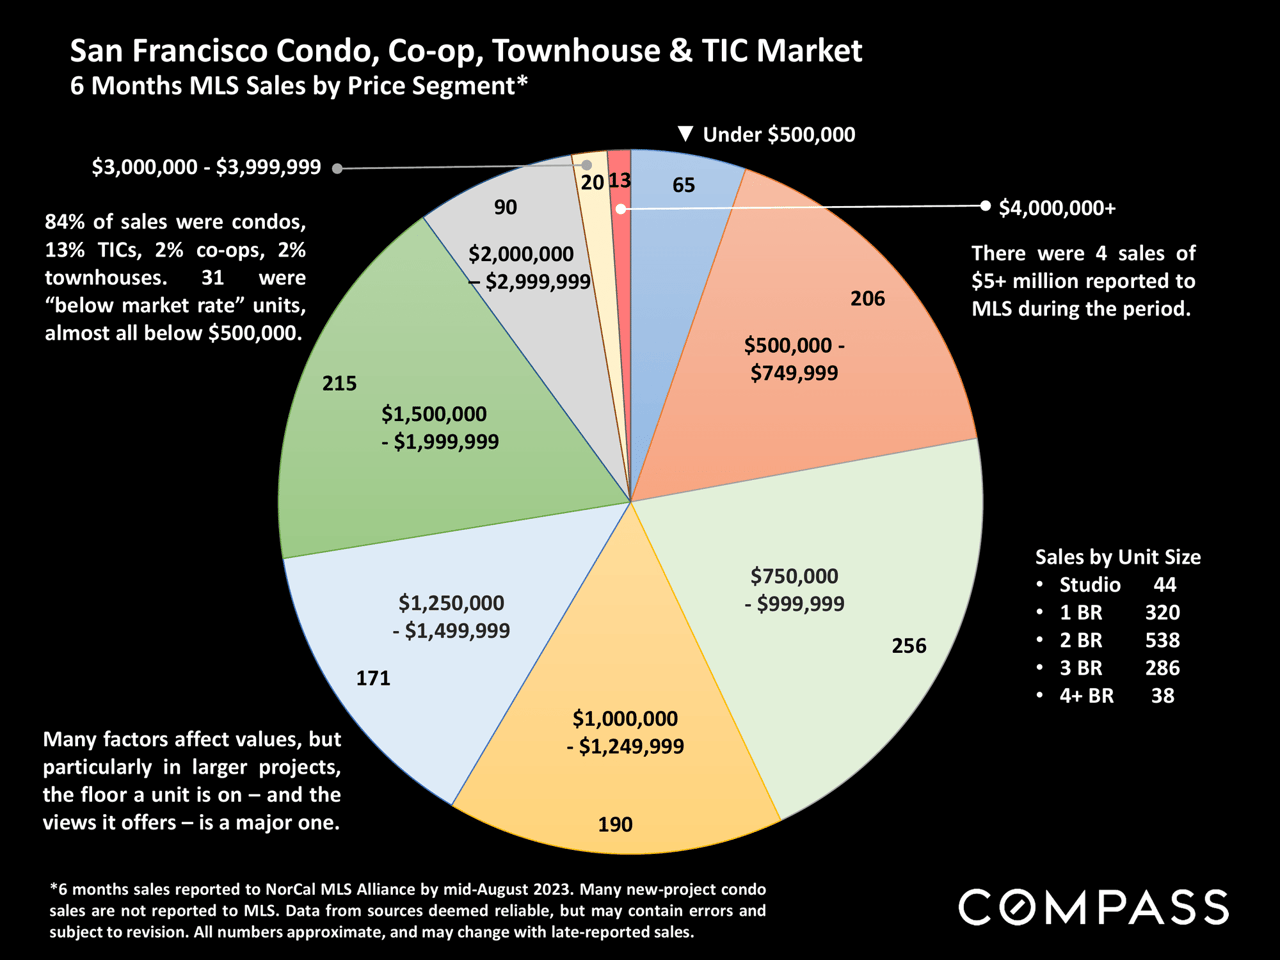
Infographic showing six months of San Francisco condo, co-op, townhouse, and TIC sales by price segment.
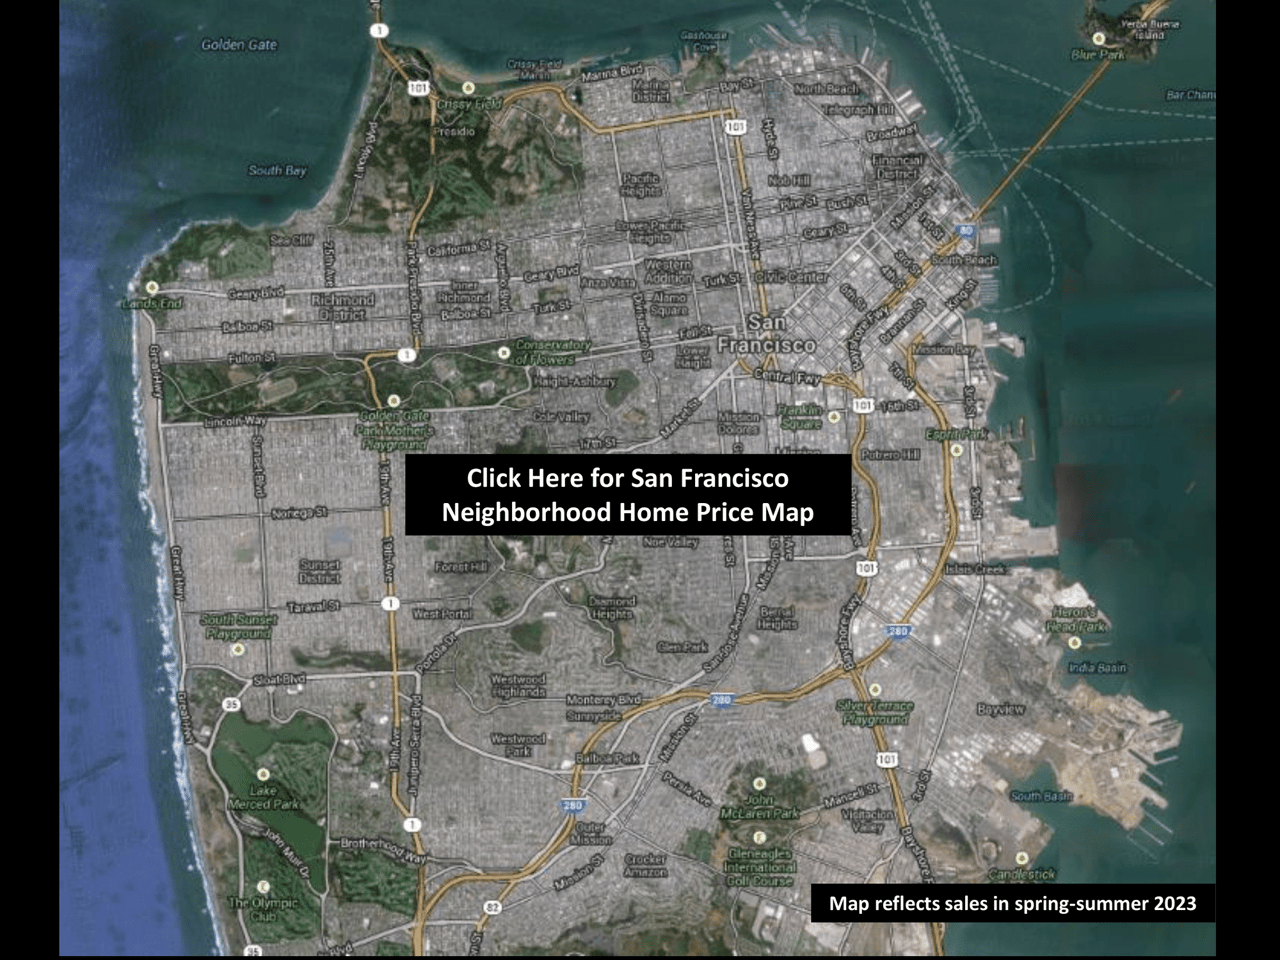
Map of San Francisco neighborhoods, with a link to the home price map and sales data from spring-summer 2023.
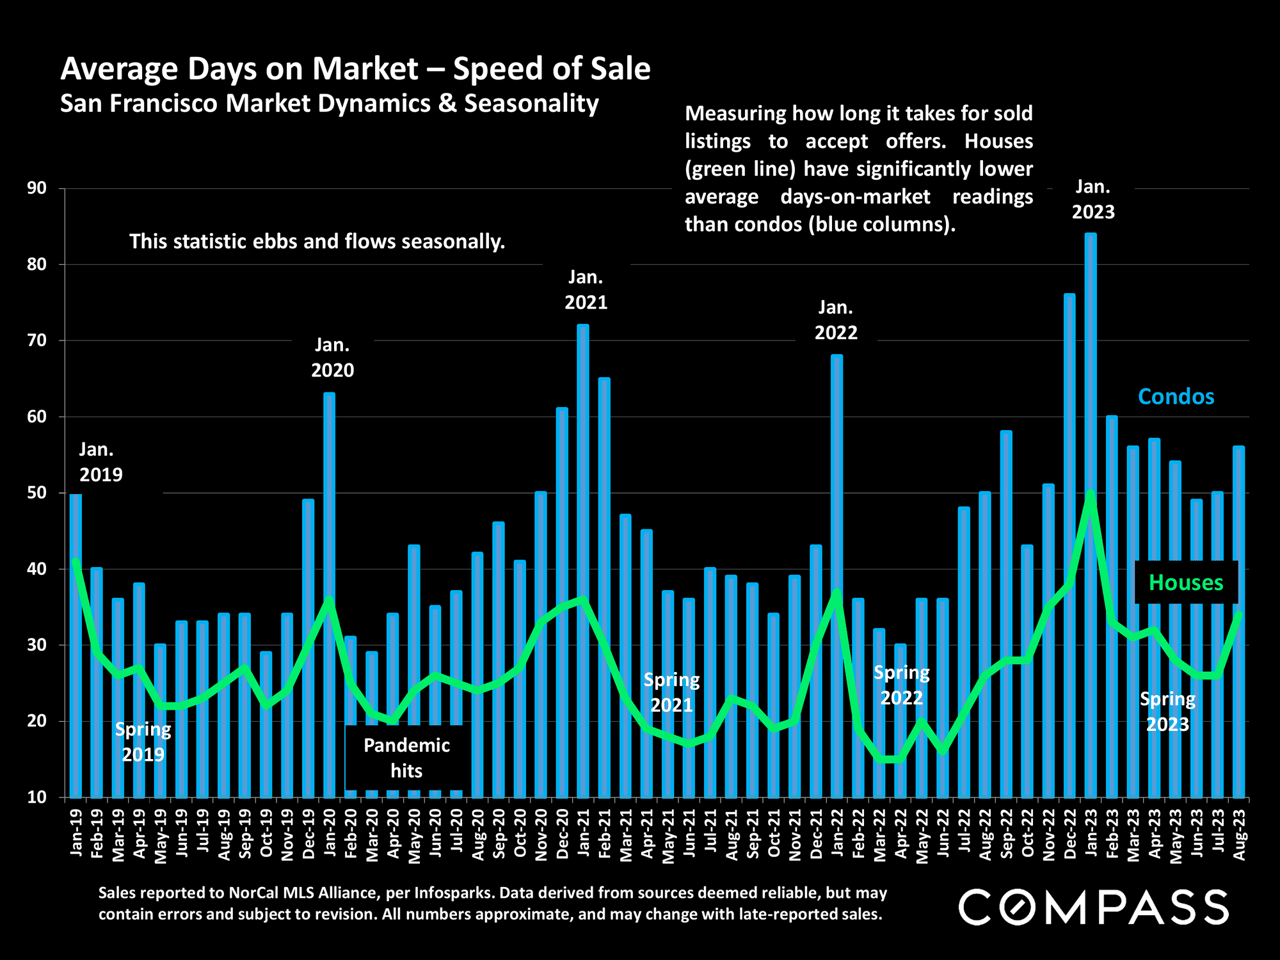
Chart comparing San Francisco house and condo days on market from January 2019 to August 2023.
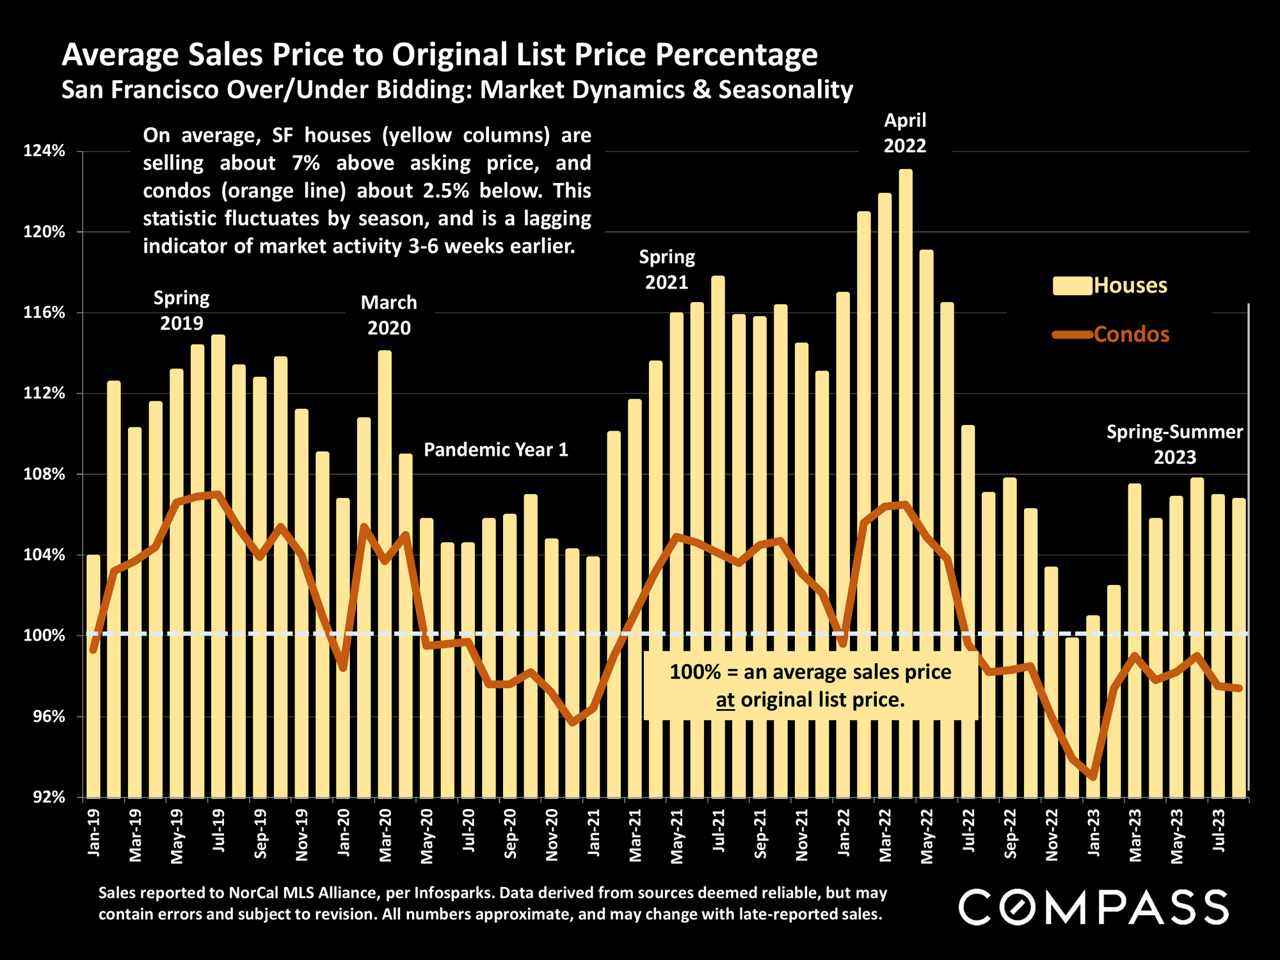
San Francisco home and condo sale prices compared with original list prices from 2019 to 2023.
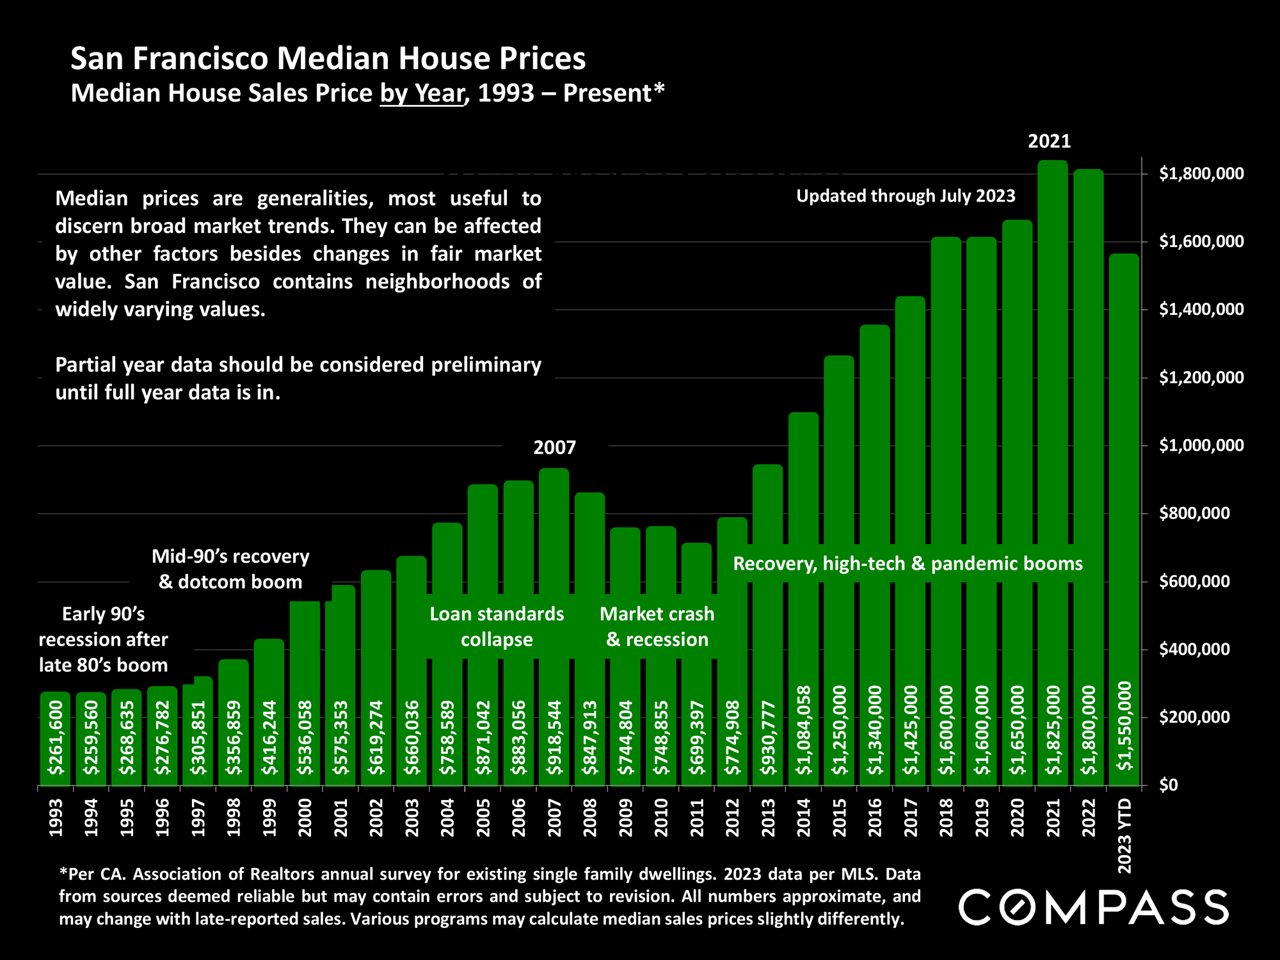
Chart of San Francisco median house prices by year, 1993–2023 YTD, with green bars and market-period annotations.
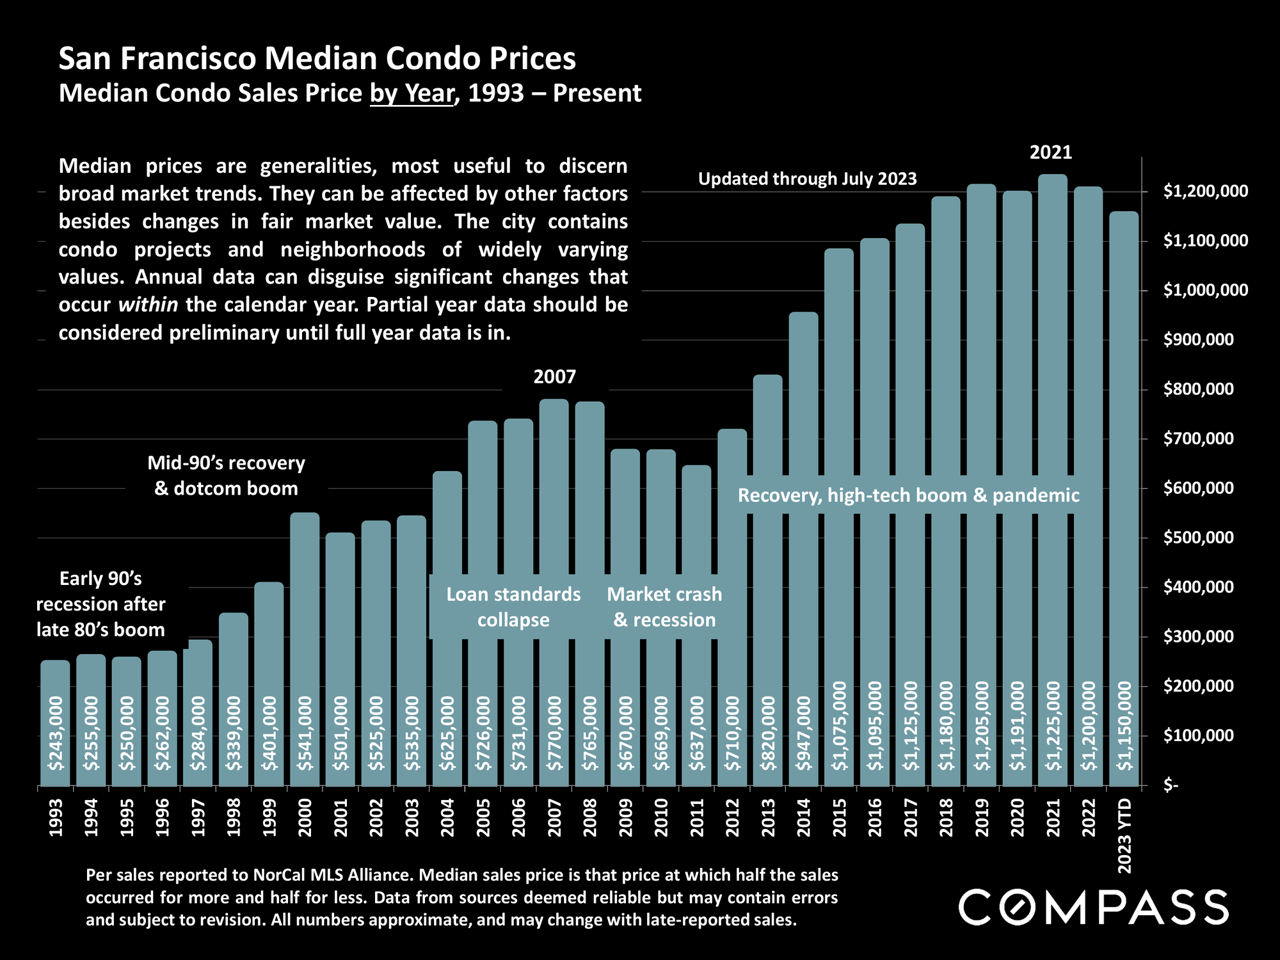
Bar chart of San Francisco median condo sale prices from 1993 through July 2023, with historical market annotations.
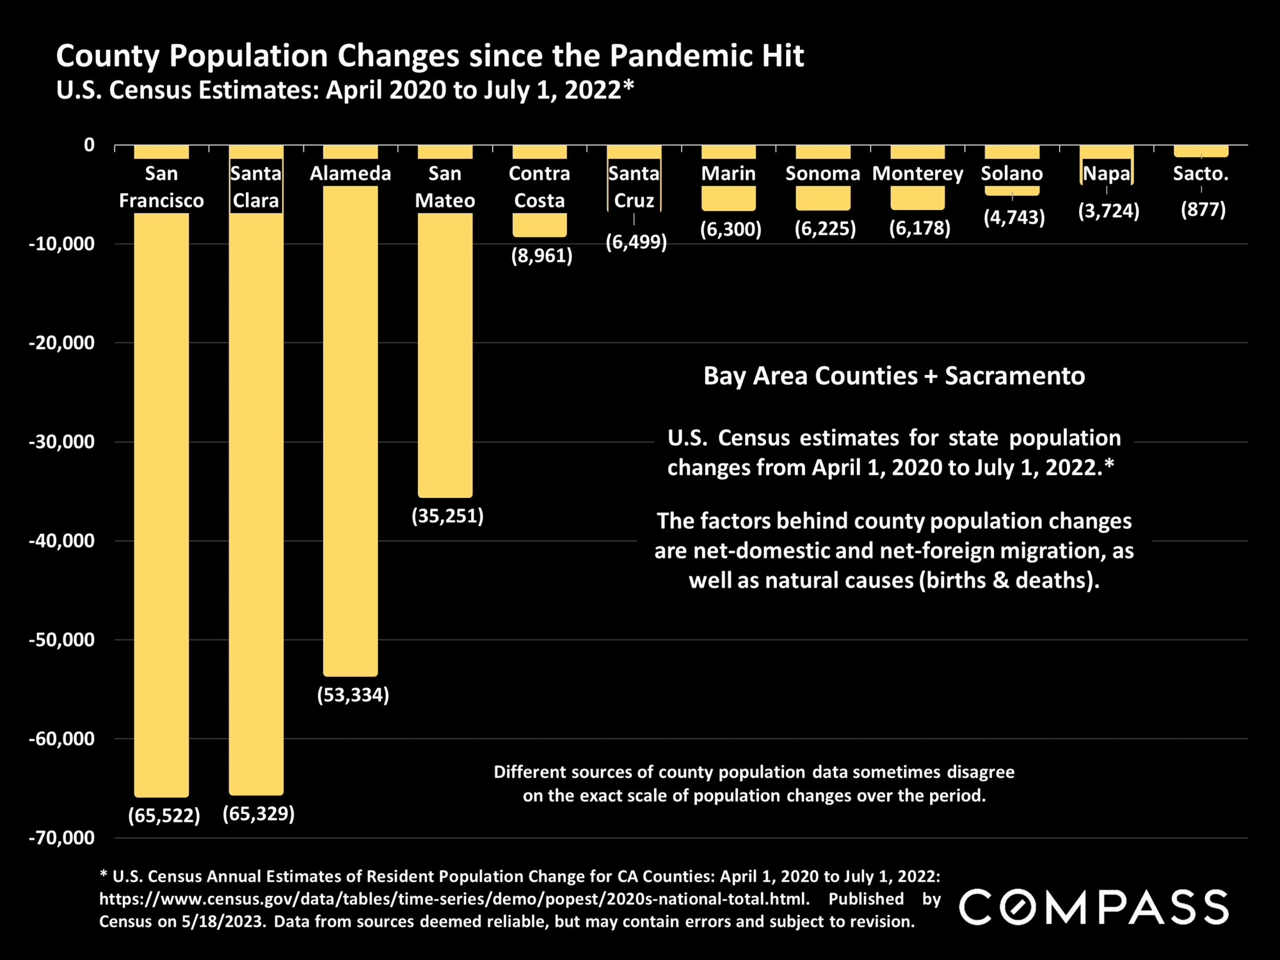
Bar chart showing population declines across Bay Area counties and Sacramento from April 2020 to July 2022.
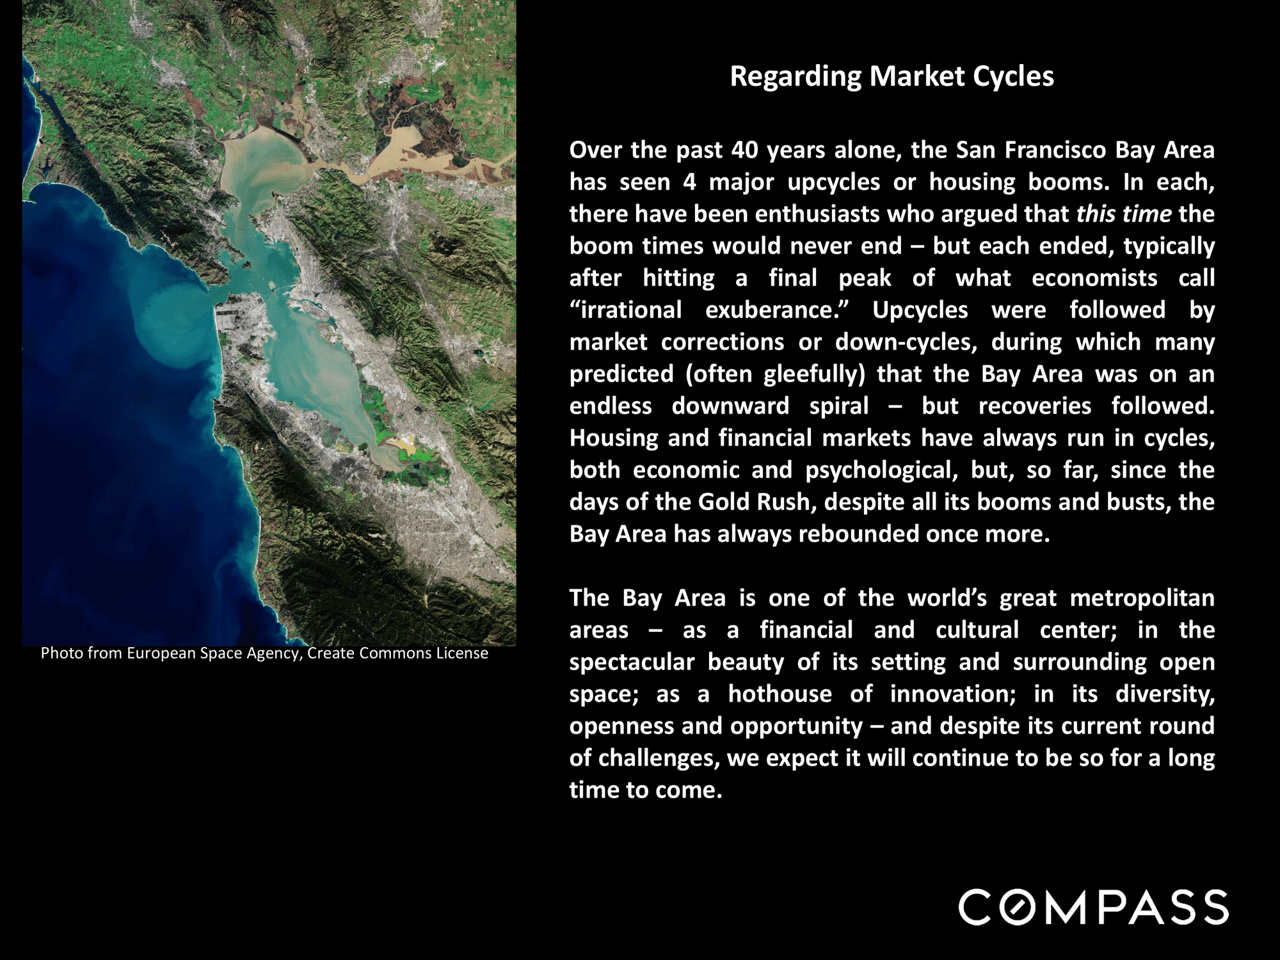
Market report slide on San Francisco Bay Area housing cycles, with a satellite view and Compass branding.
Compass graphic promoting a national real estate report, with four market charts and a dotted United States map.
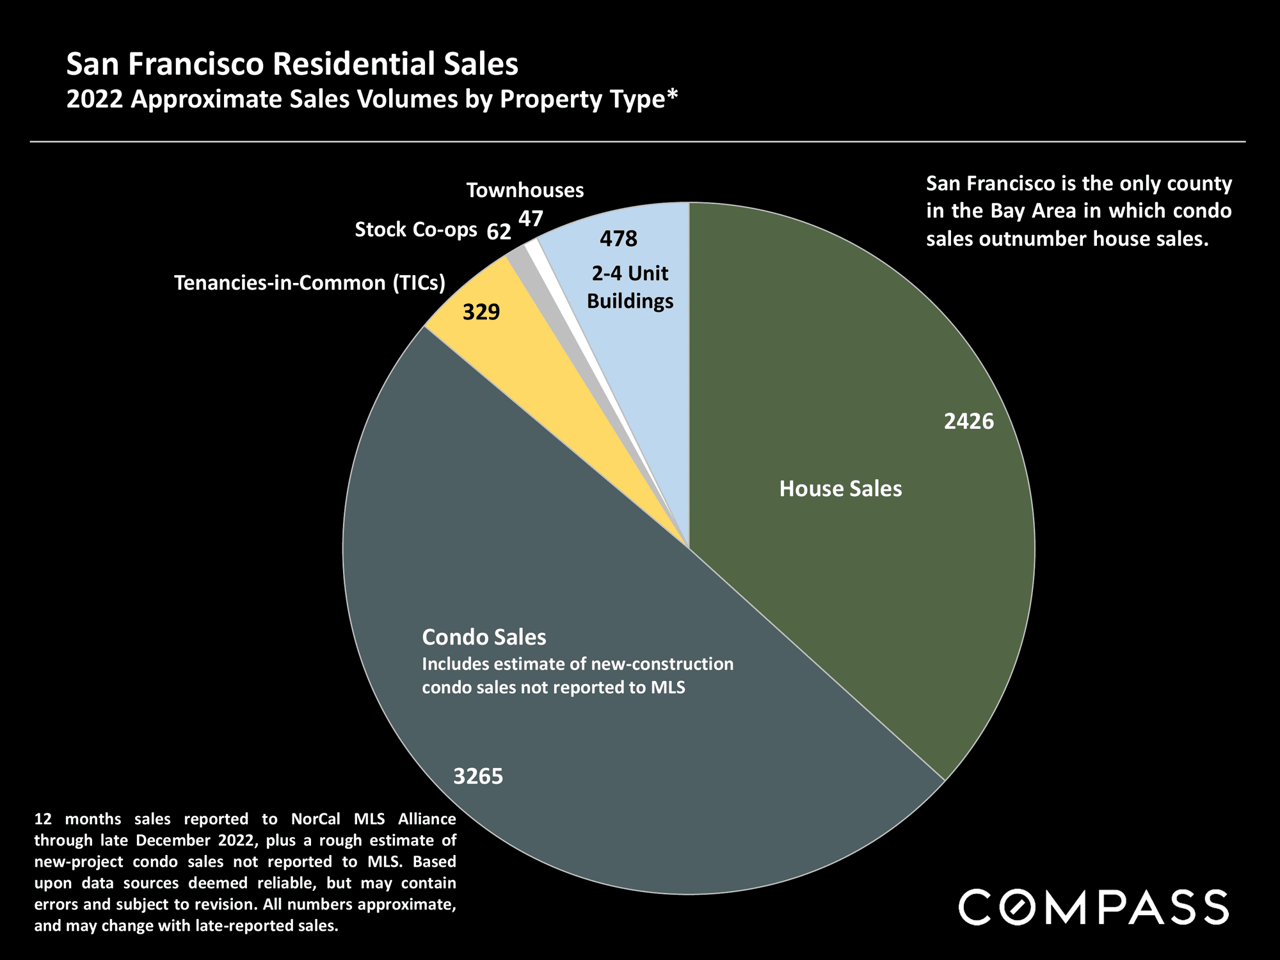
Pie chart of 2022 San Francisco residential sales, showing condo sales outnumbered house sales.
San Francisco Bay Area home price appreciation report cover with regional views and a link to the full report.
Market report notes explain statistics, median sale prices, square-foot calculations, photo licensing, and Compass disclaimers.
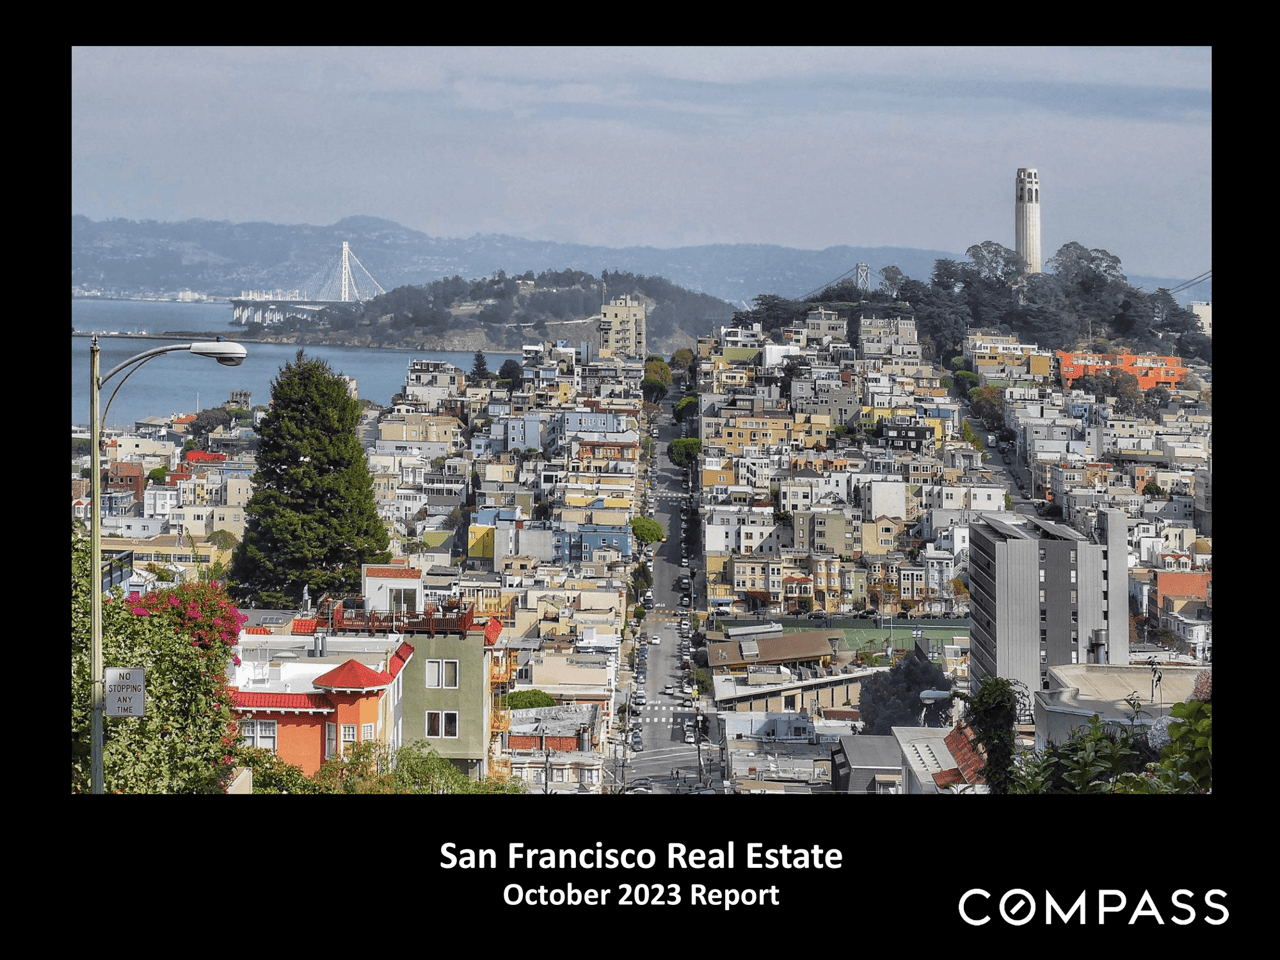
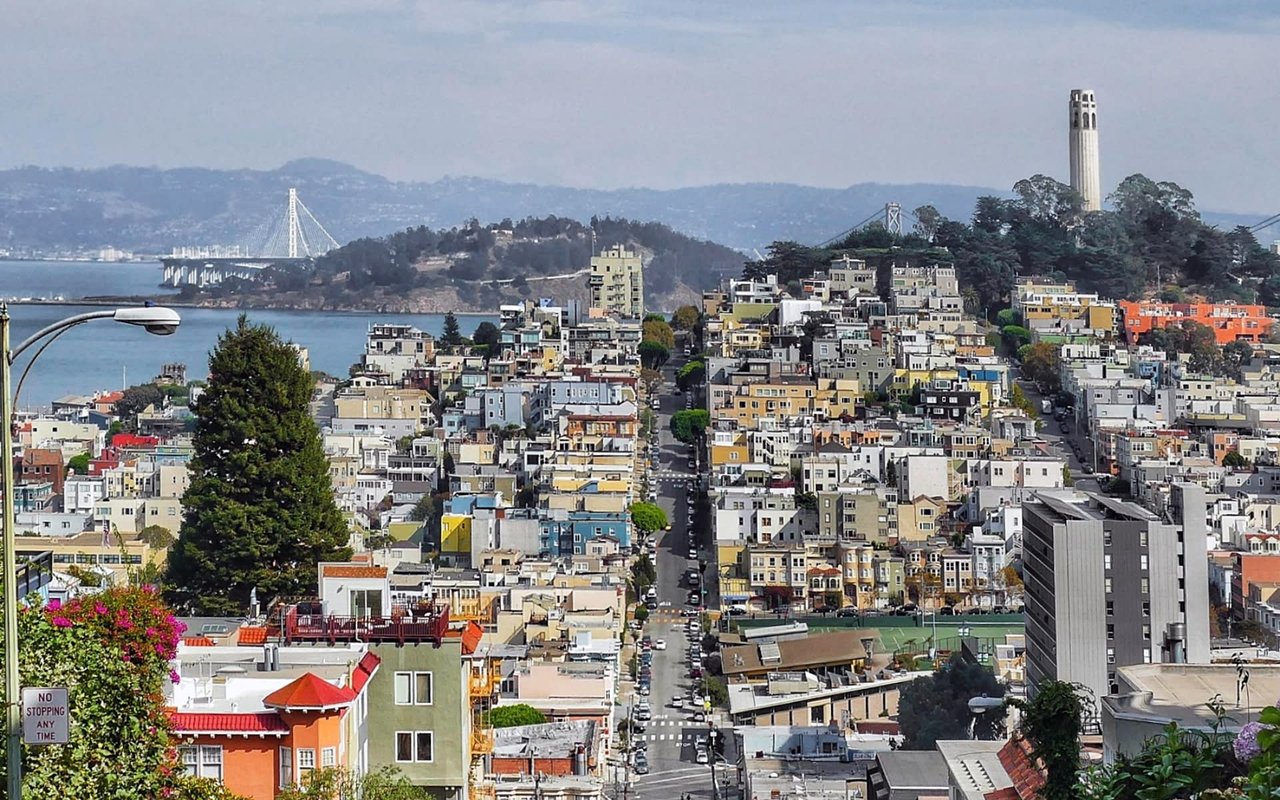
San Francisco rooftops and bay with Coit Tower and a suspension bridge in the distance.

Let’s Work Together

I love people and connecting with new opportunities. Let's talk about what's next for you, wherever you call home.