San Francisco Real Estate August 2022 Report
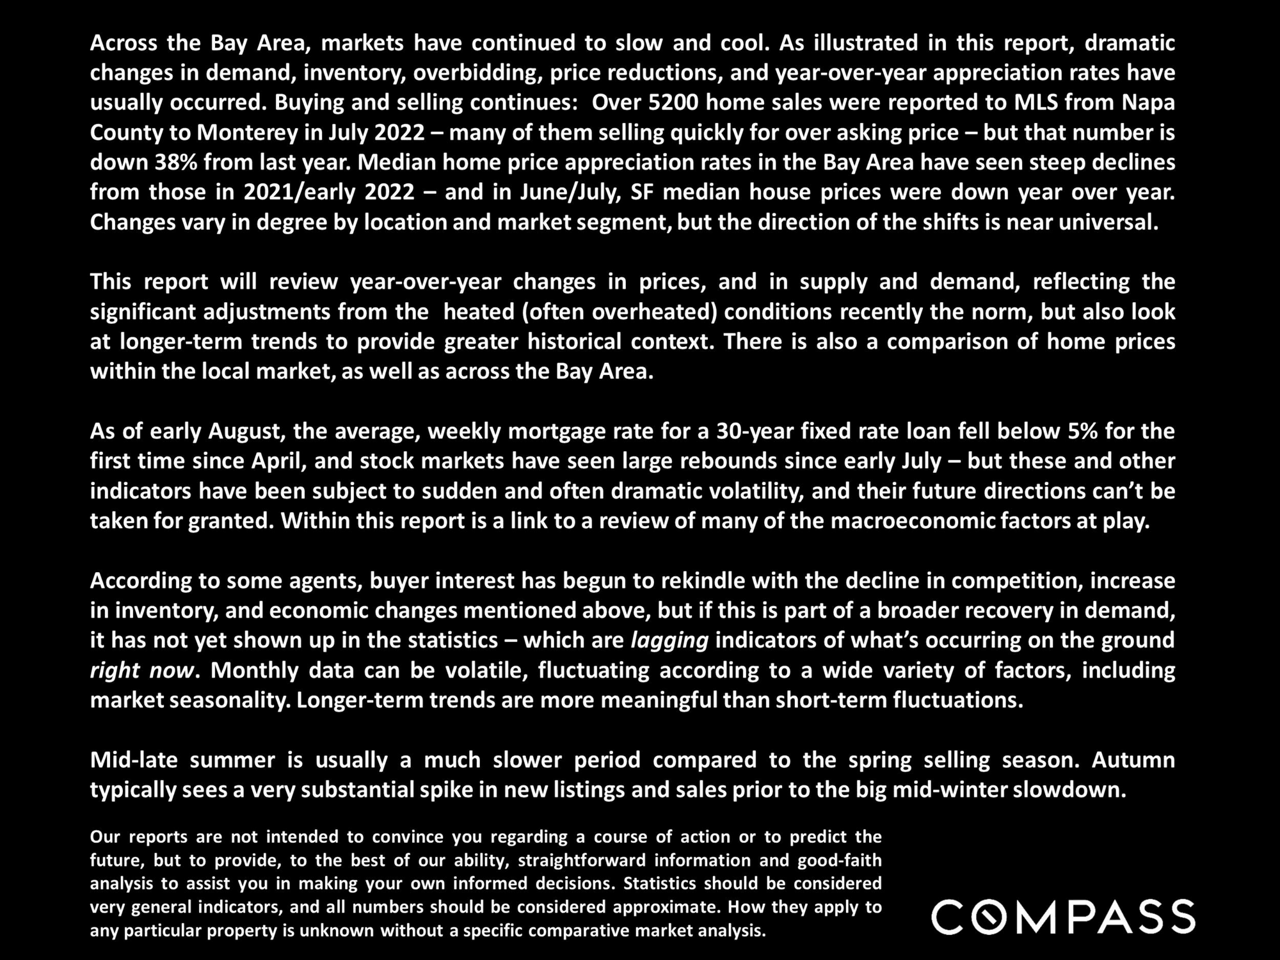
August 2022 Bay Area market report discussing sales, prices, inventory, mortgage rates, and seasonal trends.
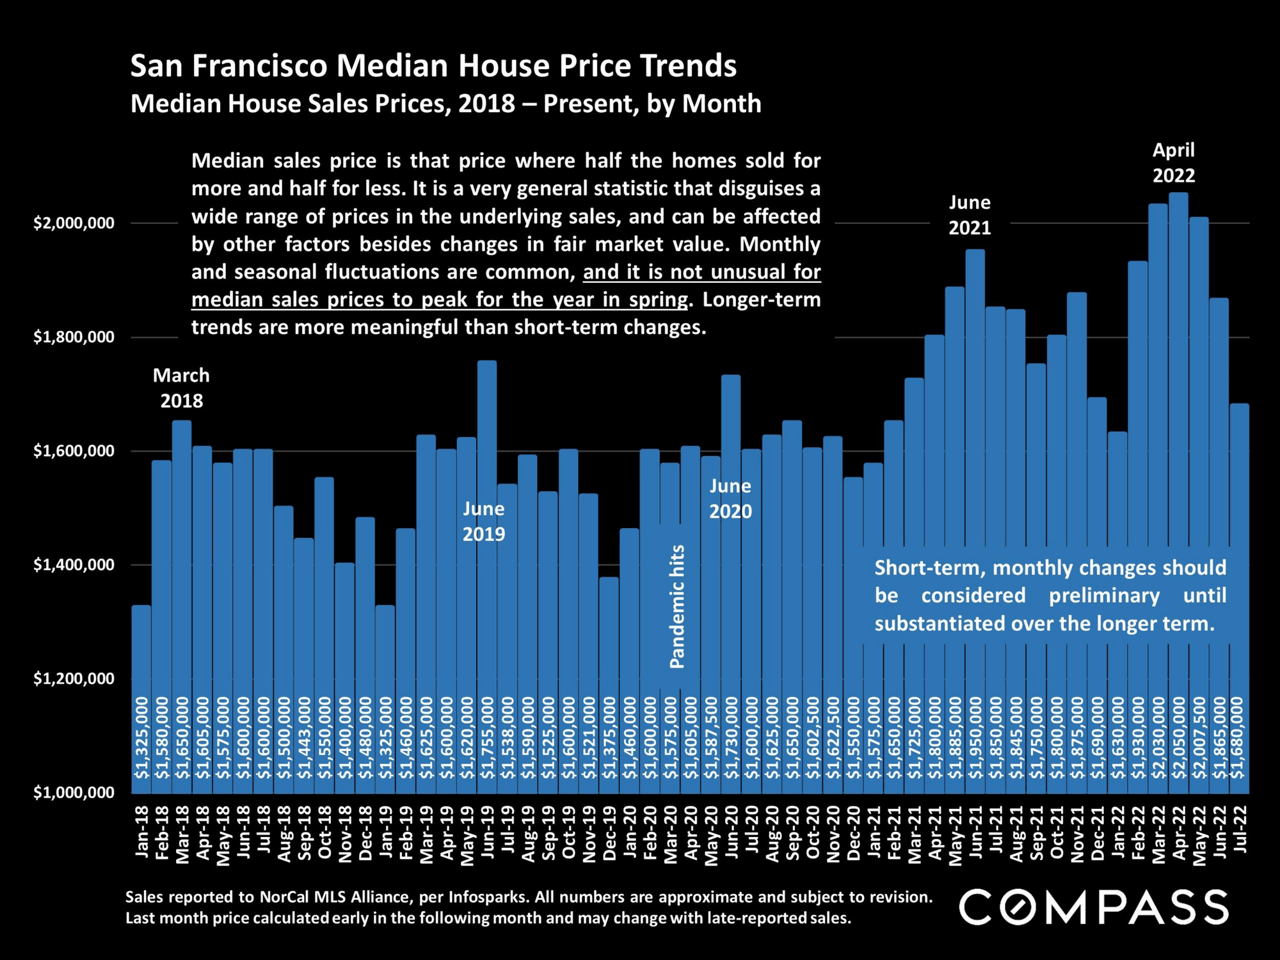
Bar chart of San Francisco monthly median house prices, 2018–2022, peaking above $2 million in spring 2022.
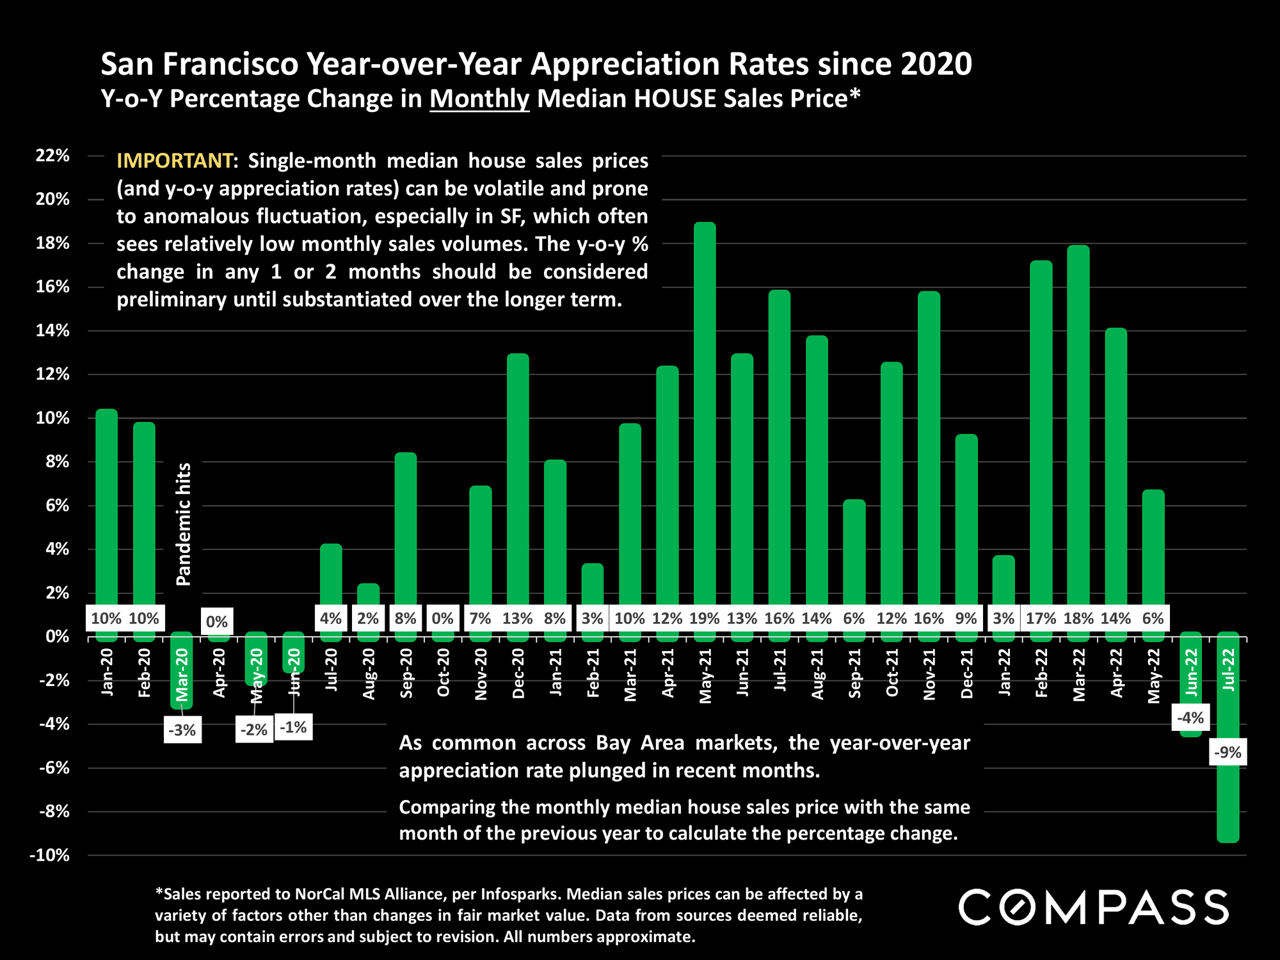
San Francisco monthly home-price appreciation chart, January 2020–July 2022, with rates falling to -9%.
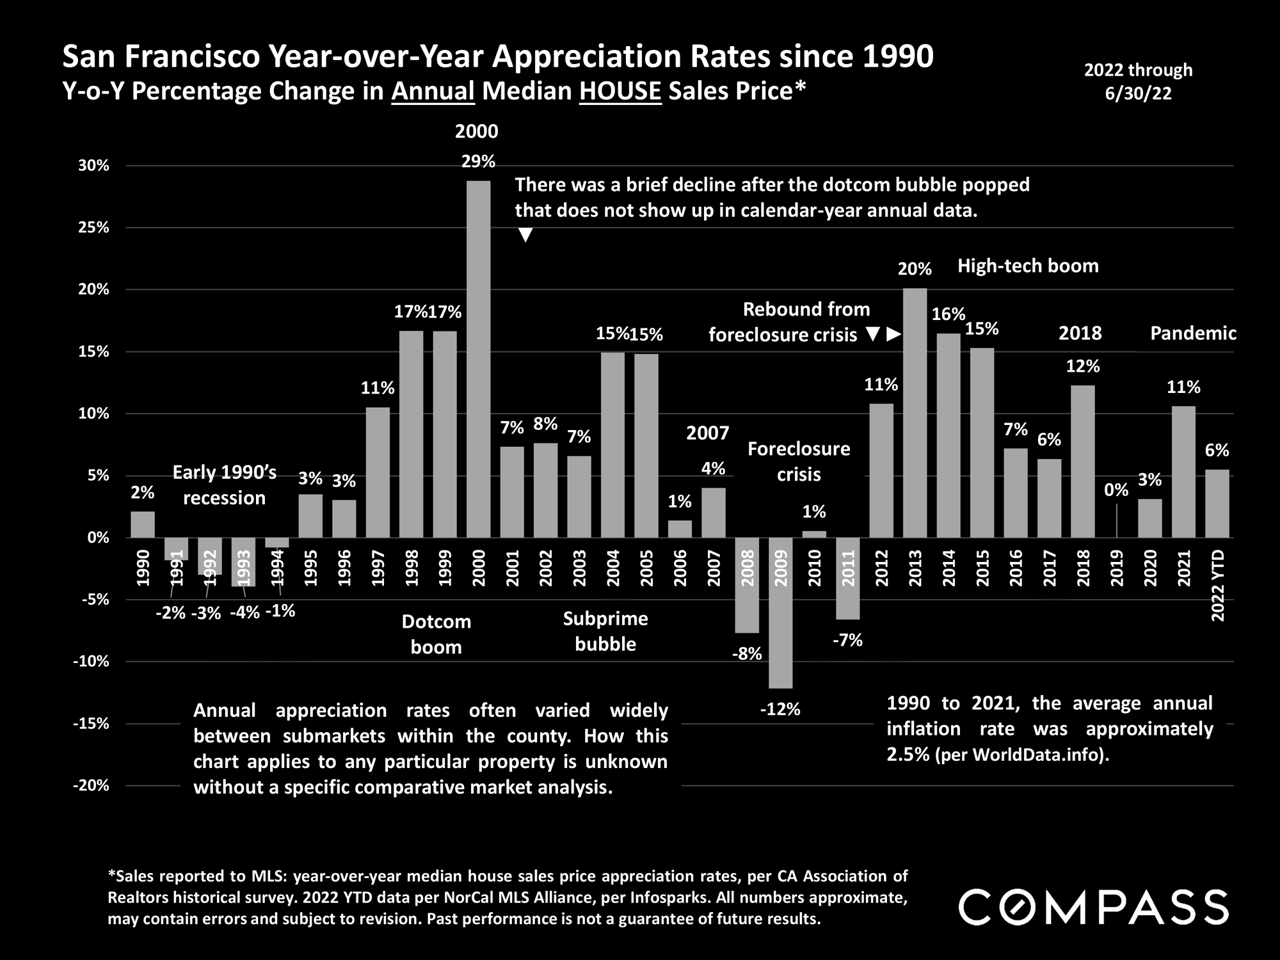
San Francisco annual median home sale price appreciation rates from 1990 through June 2022.
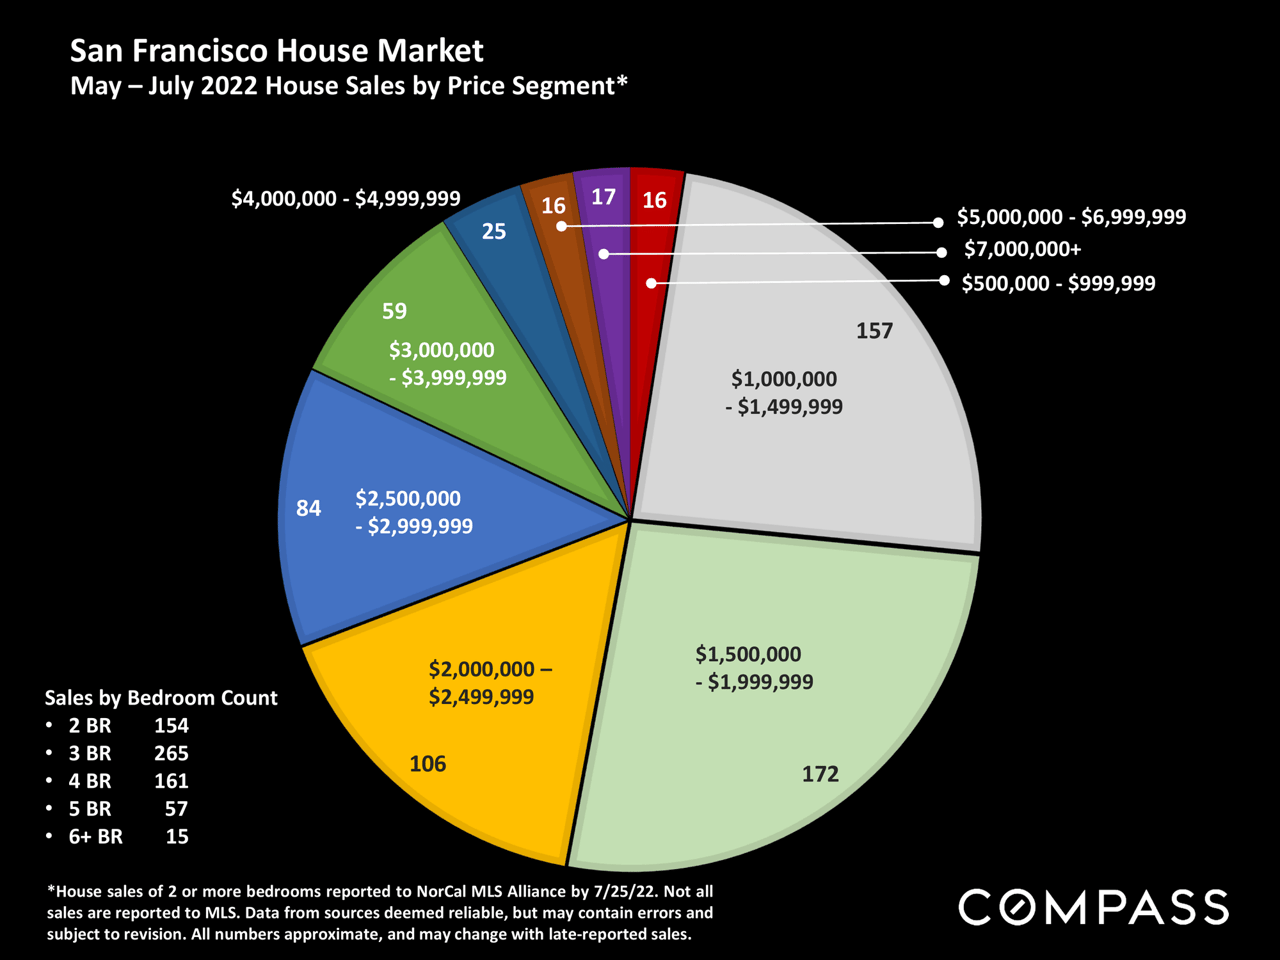
San Francisco home sales price-segment pie chart for May–July 2022, with sales counts by bedroom number.
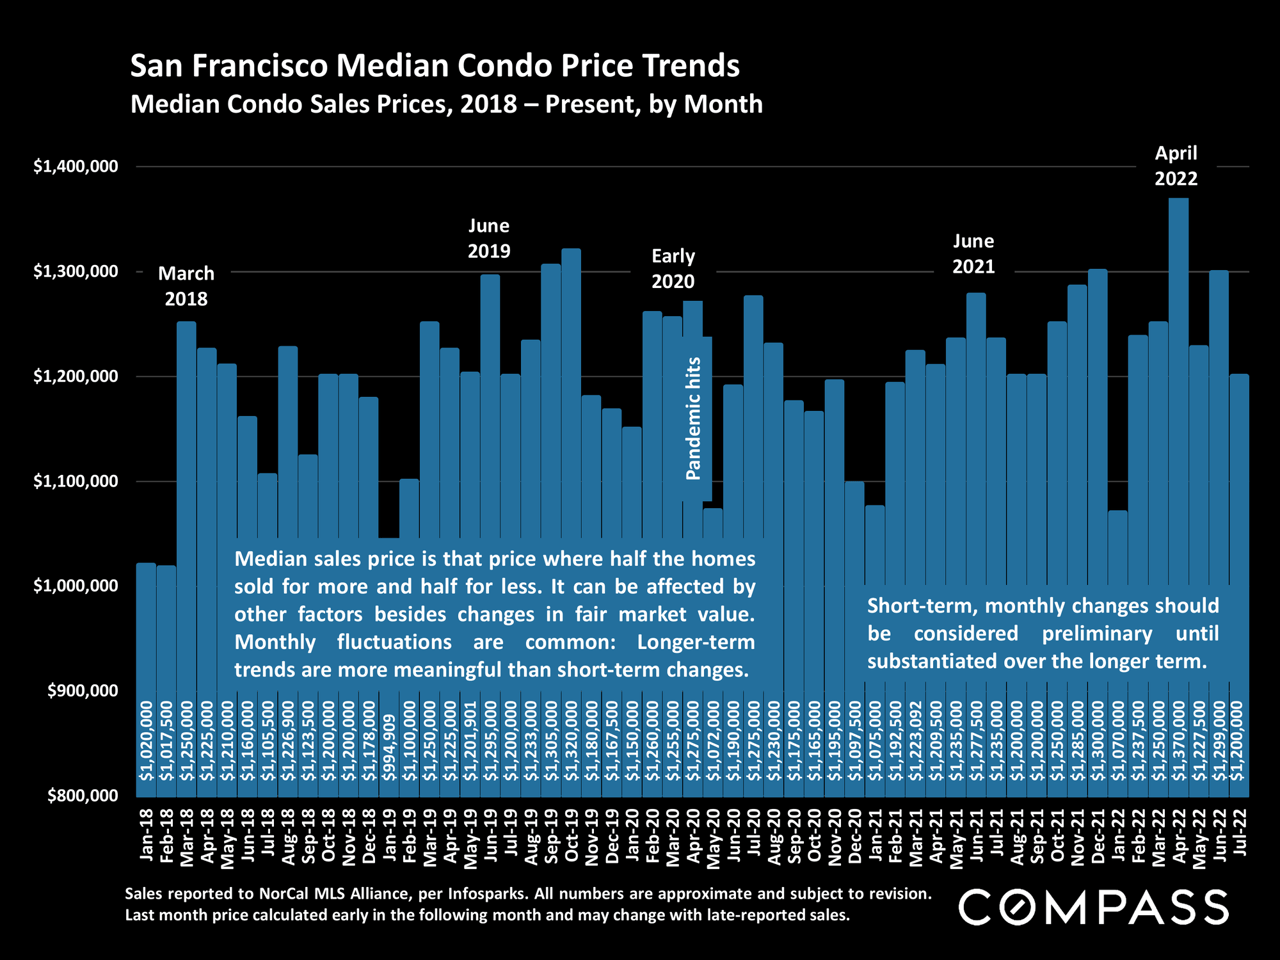
San Francisco median condo price trend chart, with monthly prices from 2018 to 2022 and a pandemic marker.
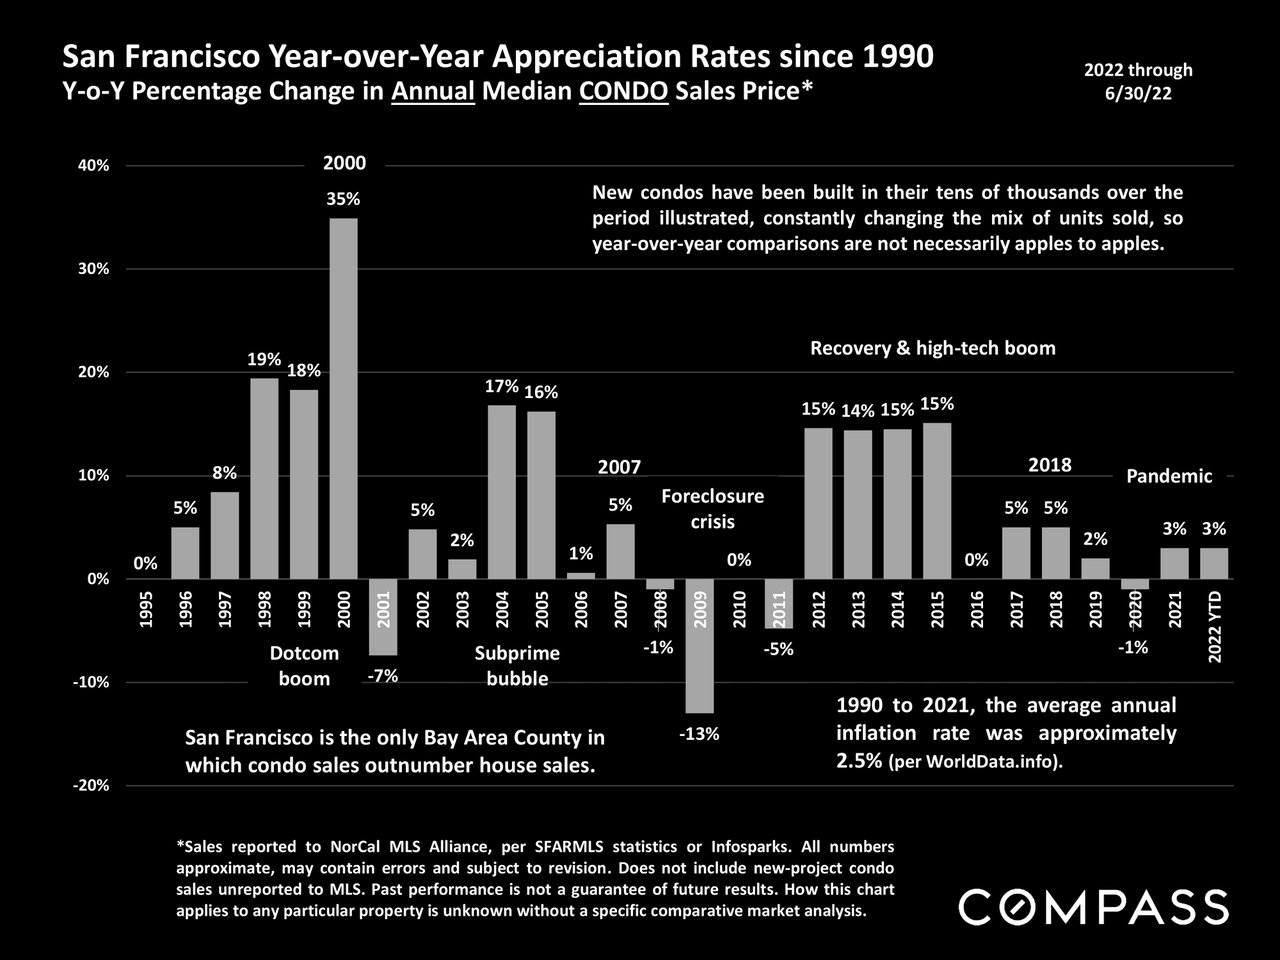
San Francisco condo price appreciation chart, with annual changes from 1995 to 2022 and labeled market cycles.
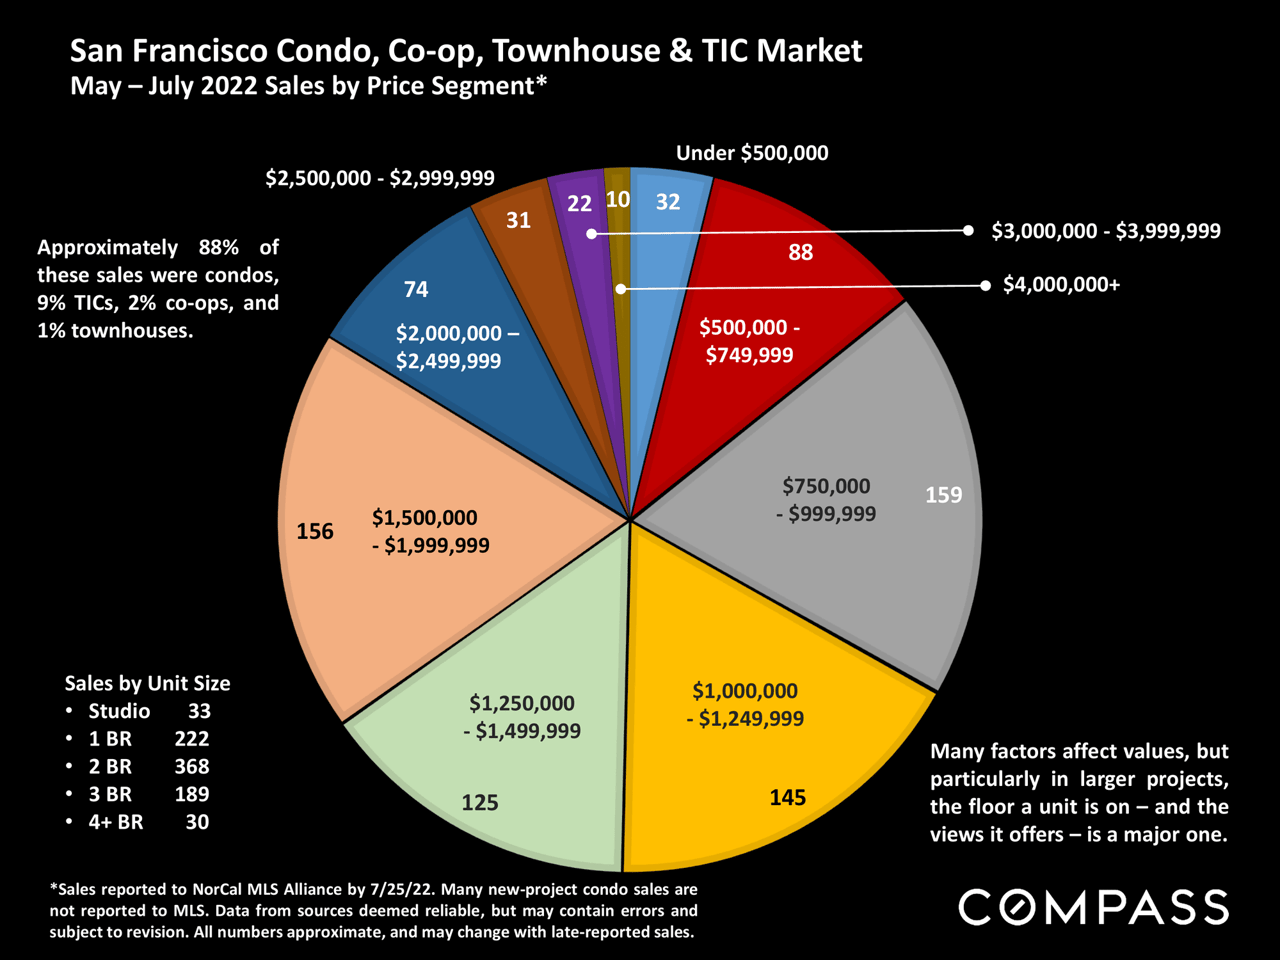
Pie chart of San Francisco home sales by price segment, May–July 2022, with unit-size and property-type breakdowns.
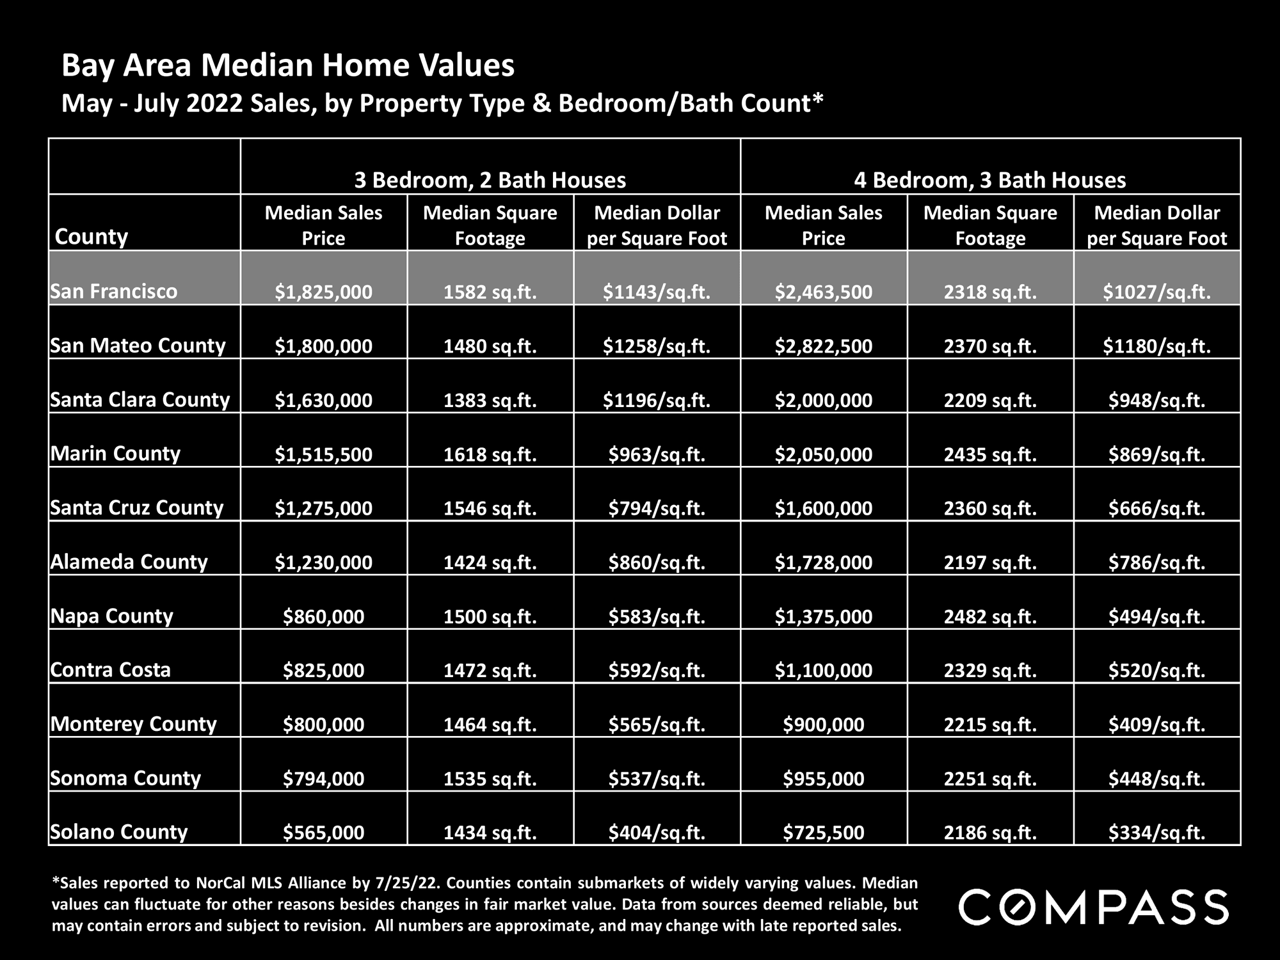
Chart comparing May–July 2022 median home prices and home sizes across Bay Area counties.
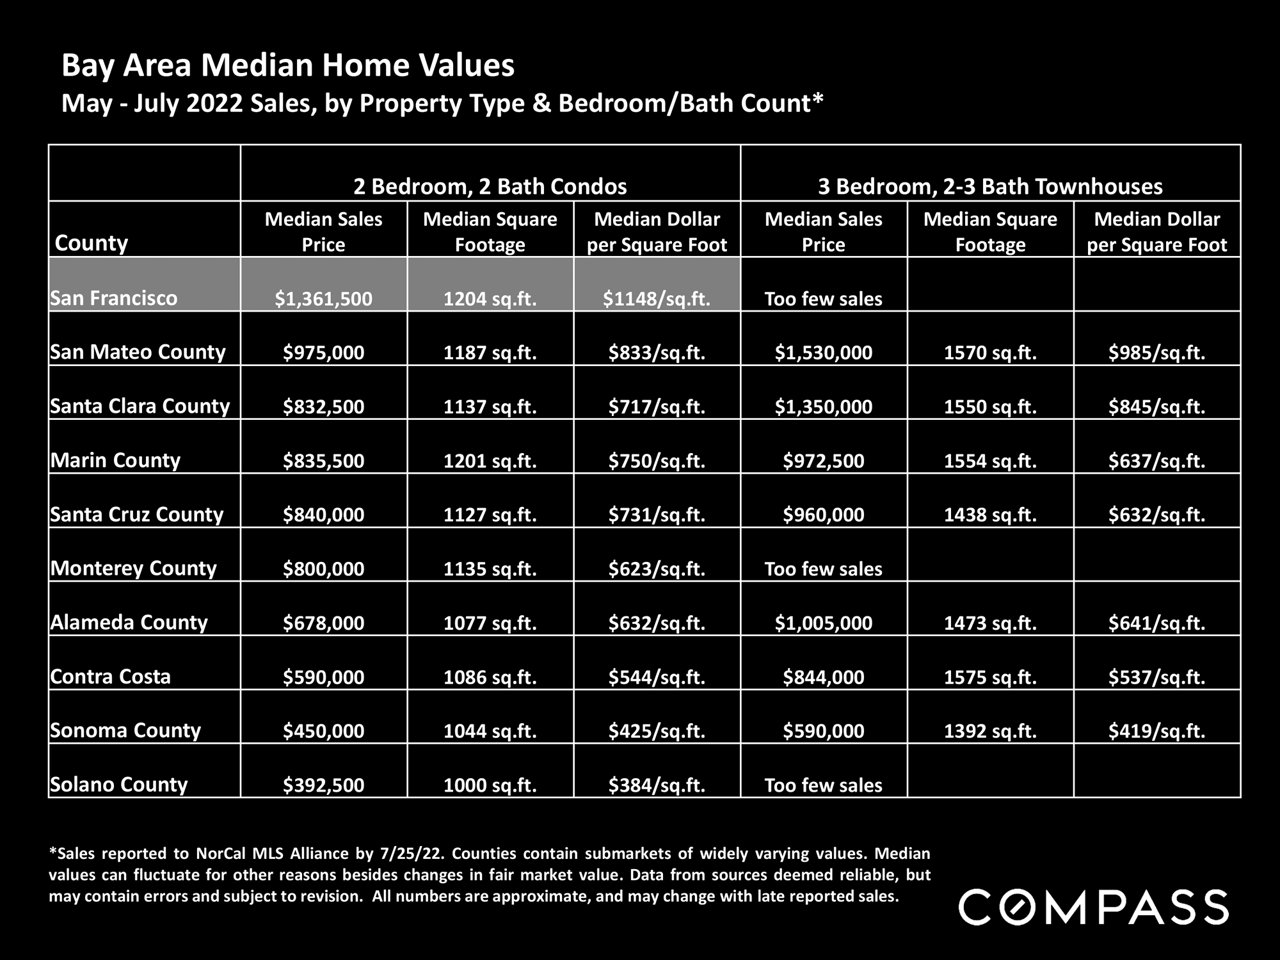
Table of May–July 2022 Bay Area median home values for condos and townhouses by county.
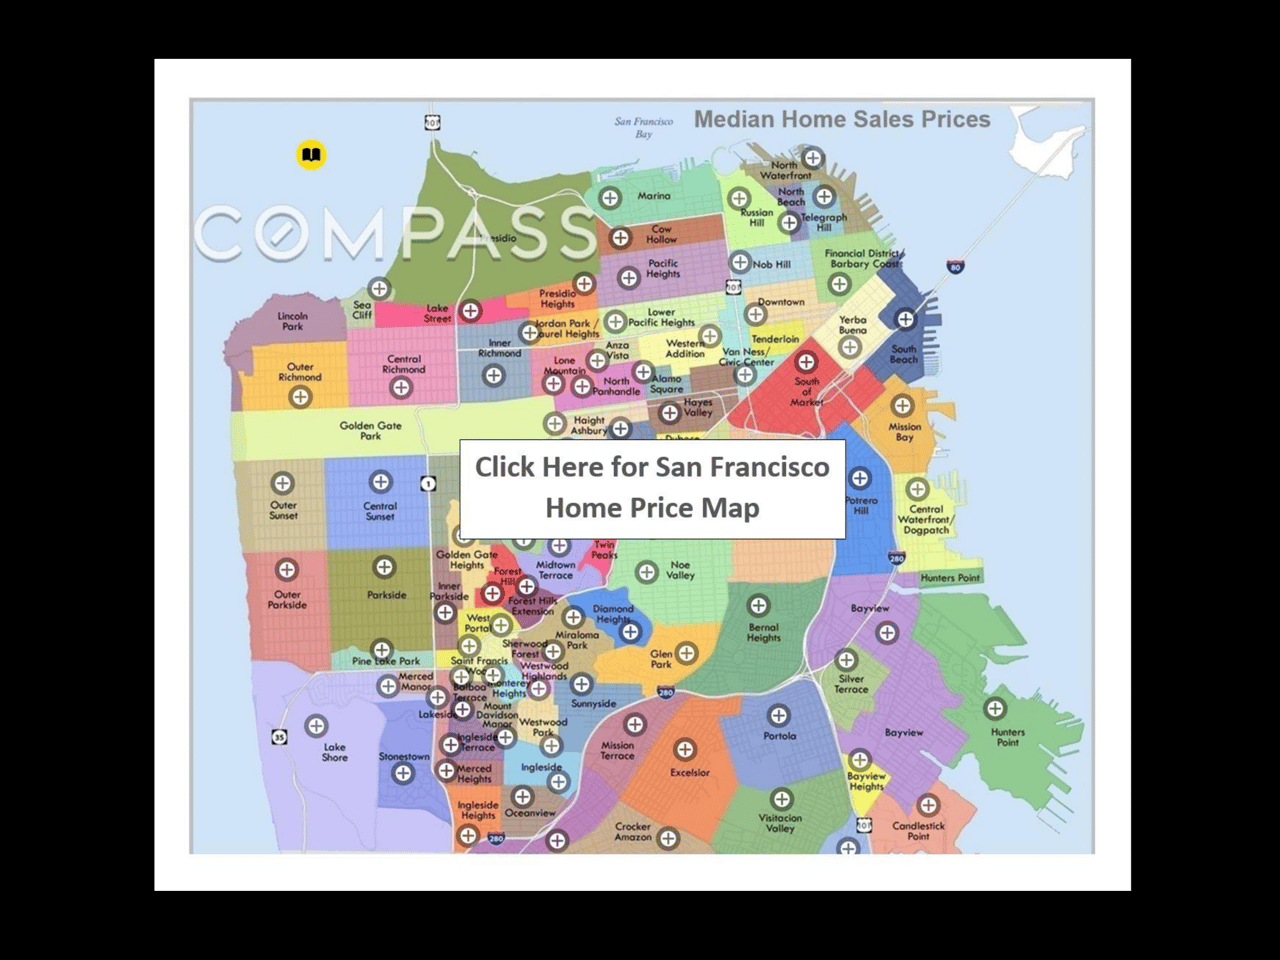
Color-coded San Francisco neighborhood map of median home sales prices with a central home price map link.
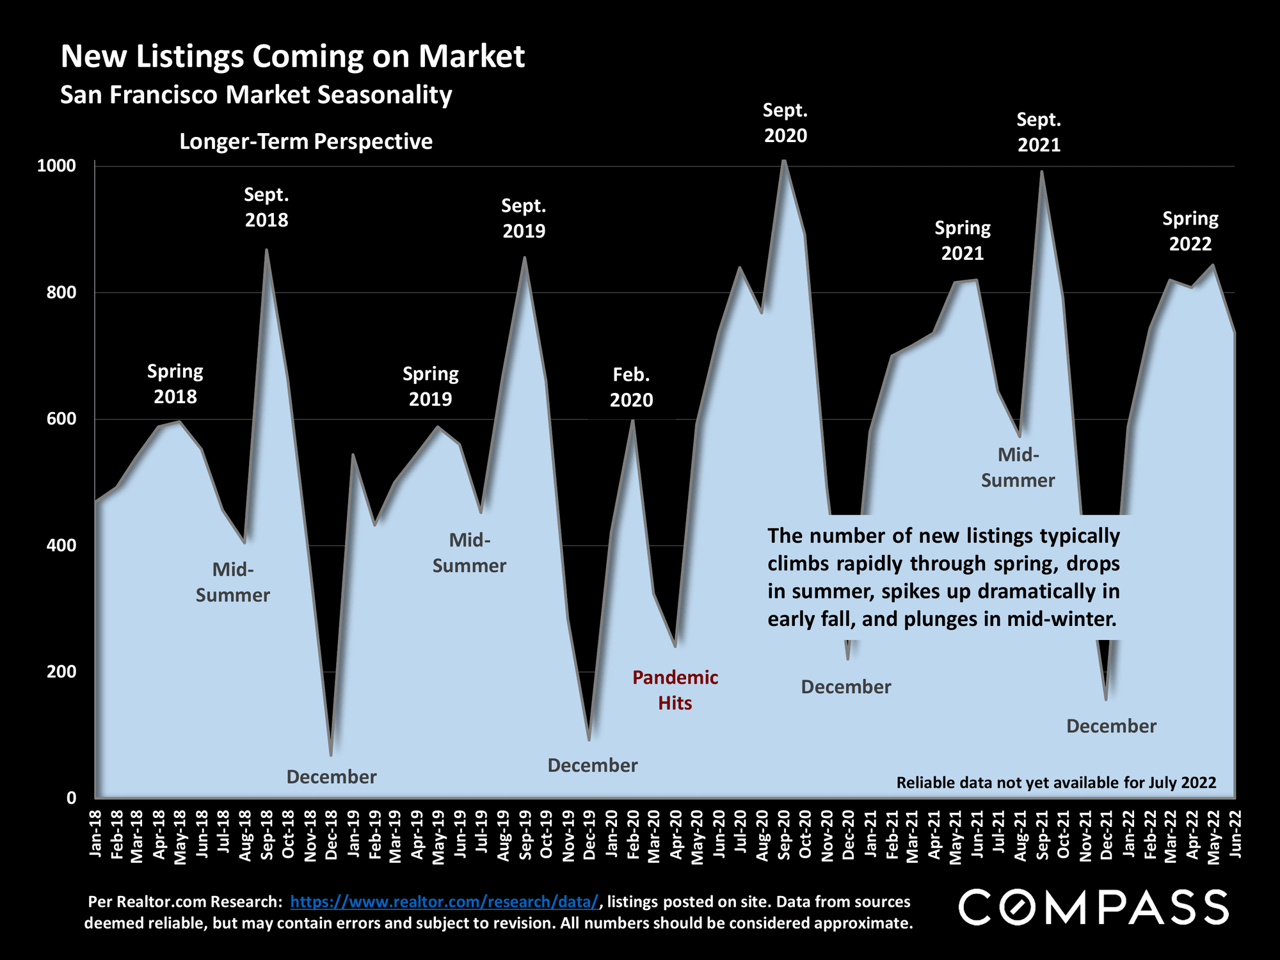
Chart of San Francisco new listings, showing seasonal spikes in early fall and lows in winter from 2018 to 2022.
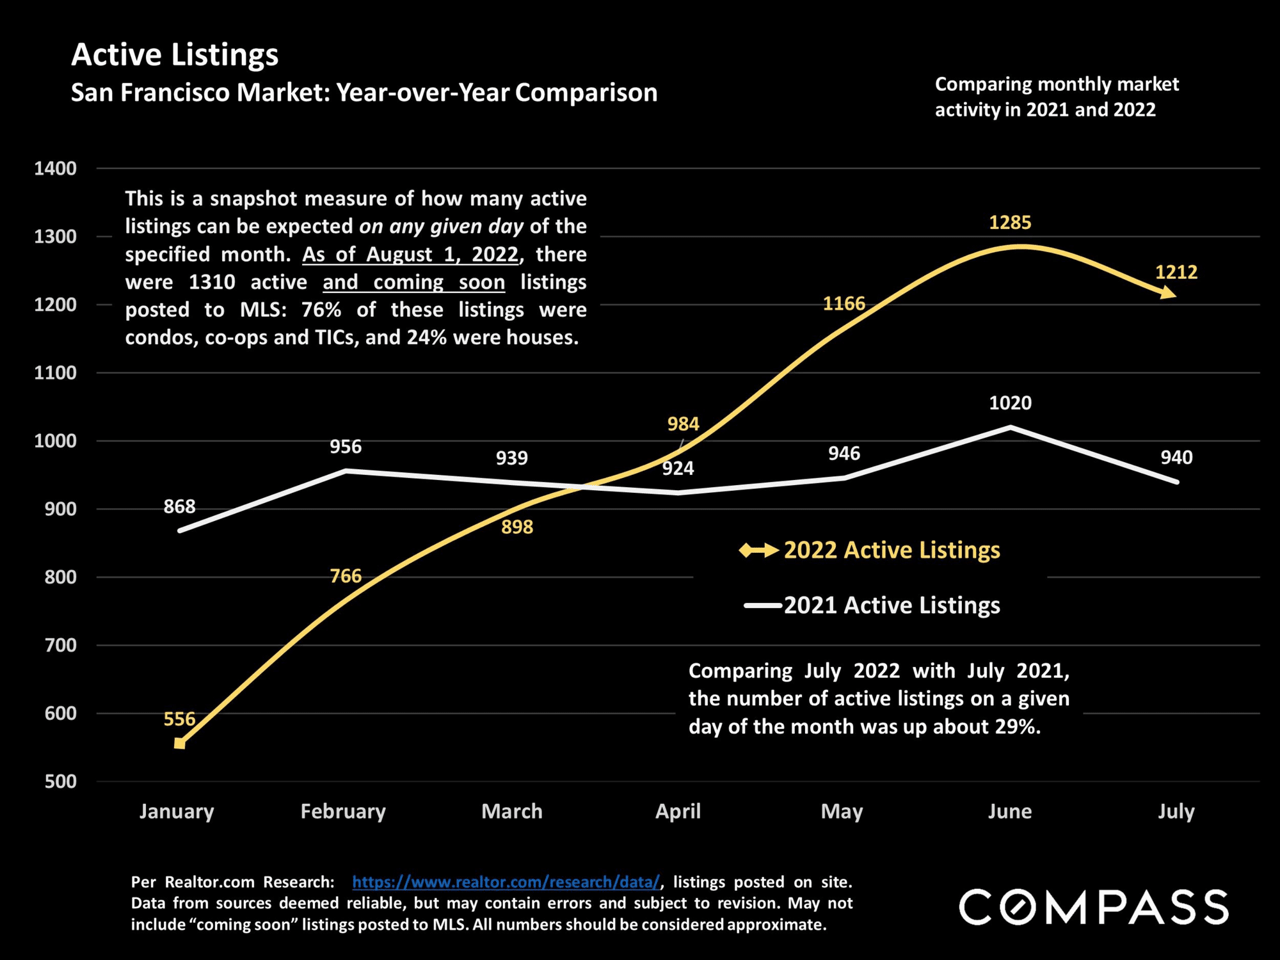
San Francisco active listings chart comparing 2021 and 2022, with 2022 peaking at 1,285 listings in June.
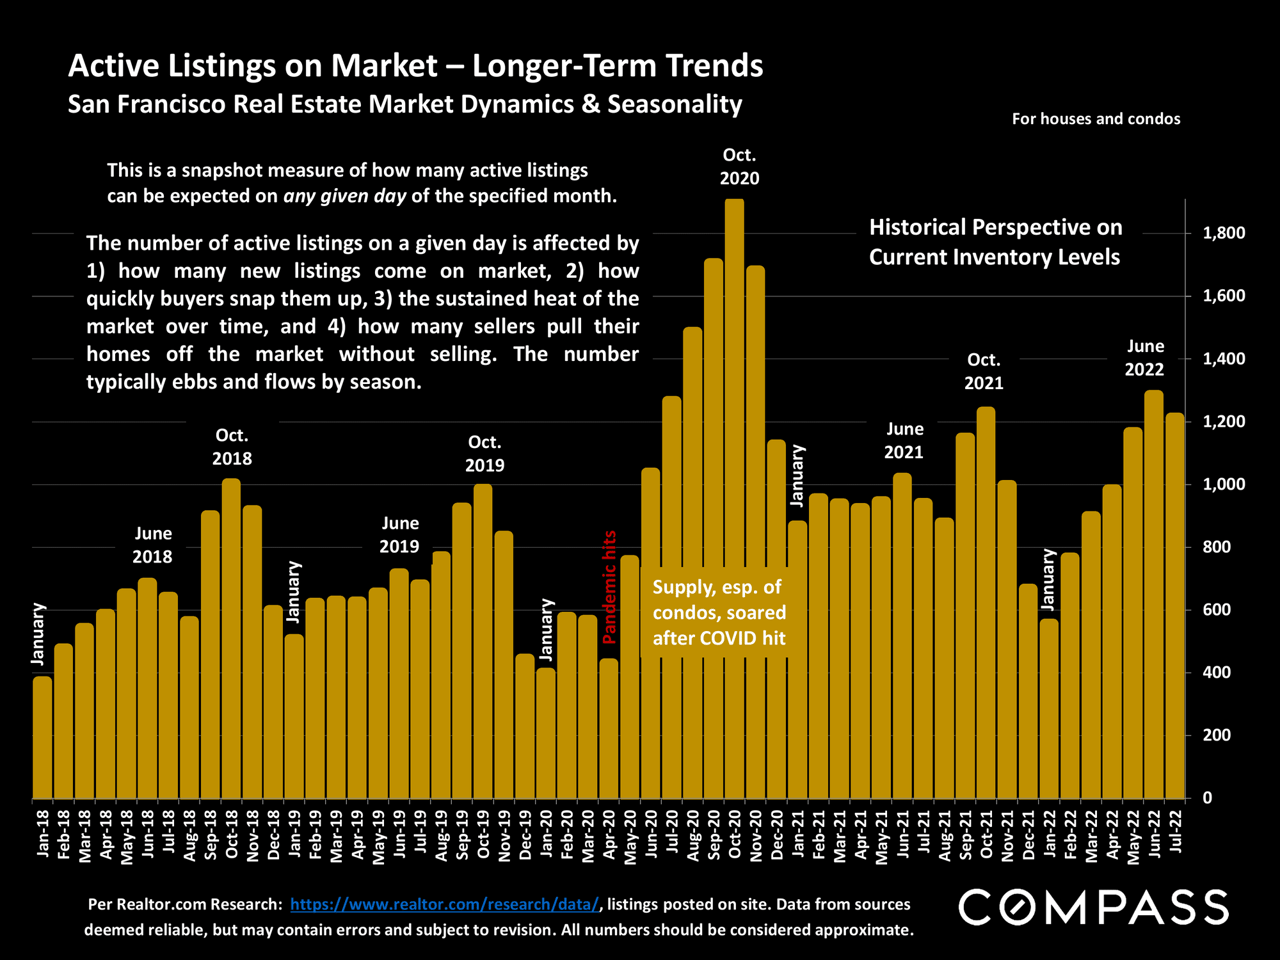
Bar chart of San Francisco active listings, January 2018–July 2022, with a sharp inventory surge in 2020.
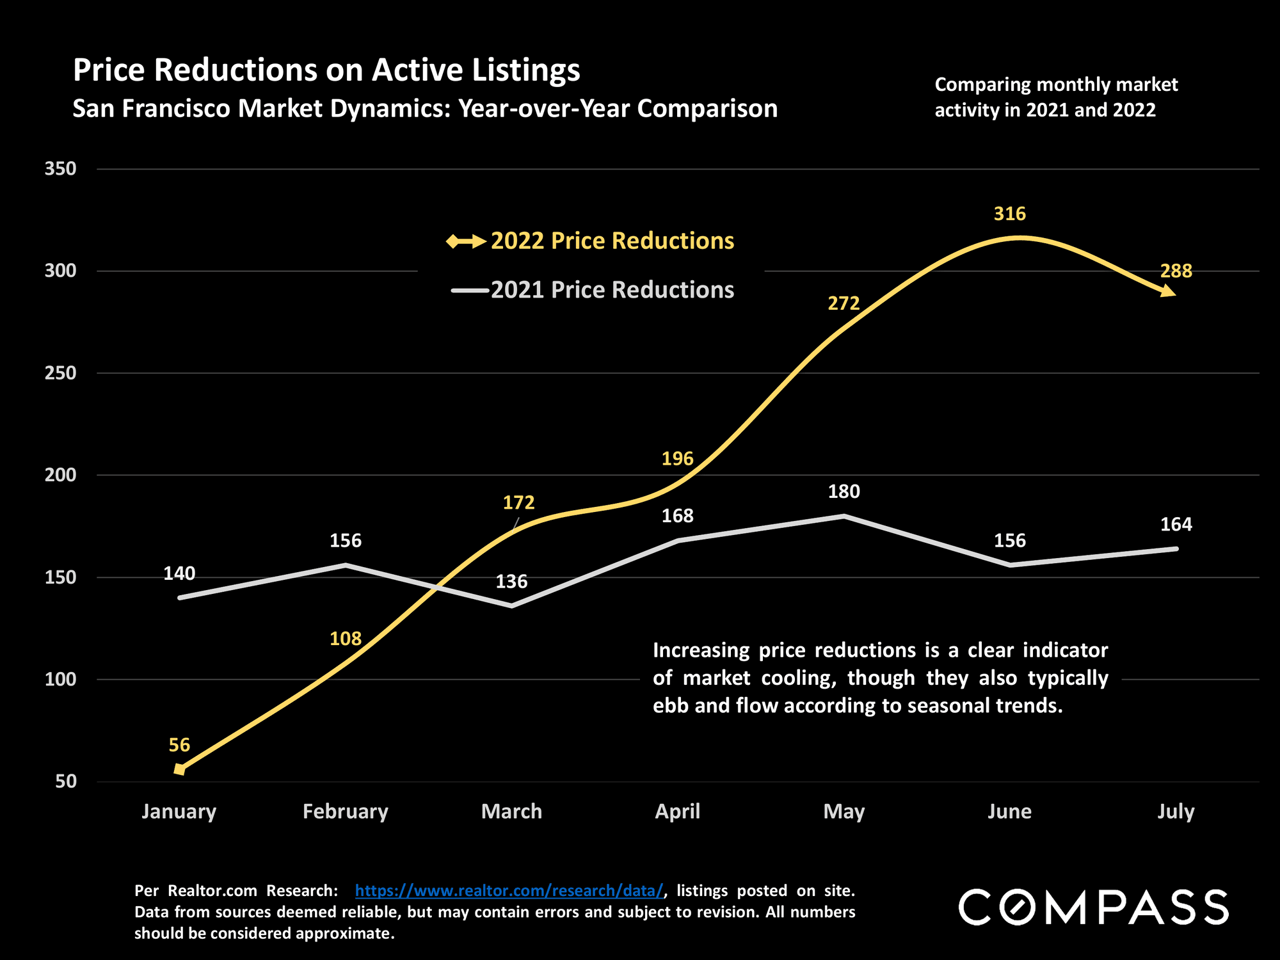
Chart comparing monthly San Francisco price reductions in 2021 and 2022, with 2022 peaking at 316 in June.
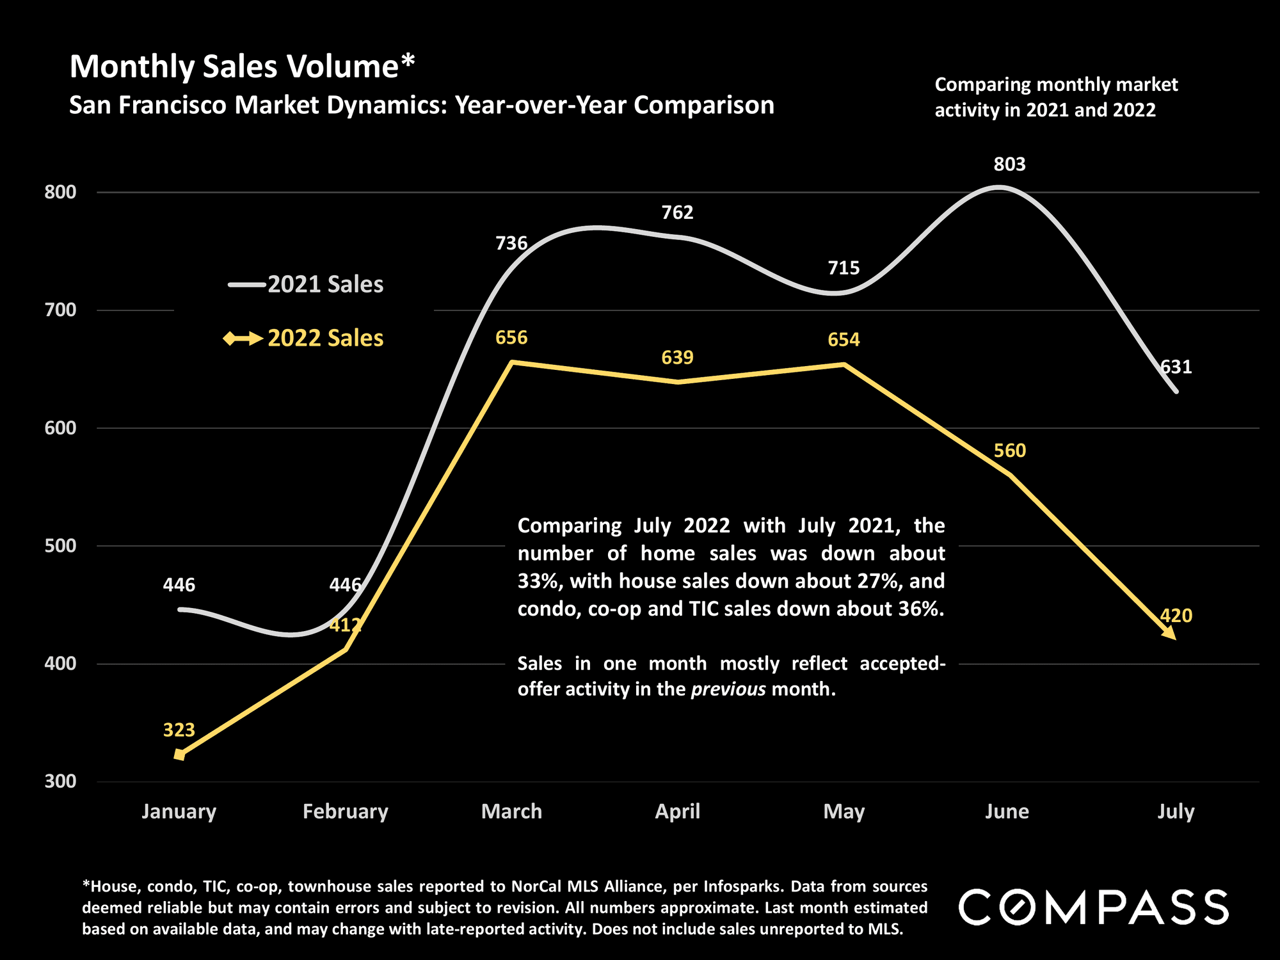
Chart comparing monthly San Francisco home sales in 2021 and 2022, with July sales down about 33% year over year.
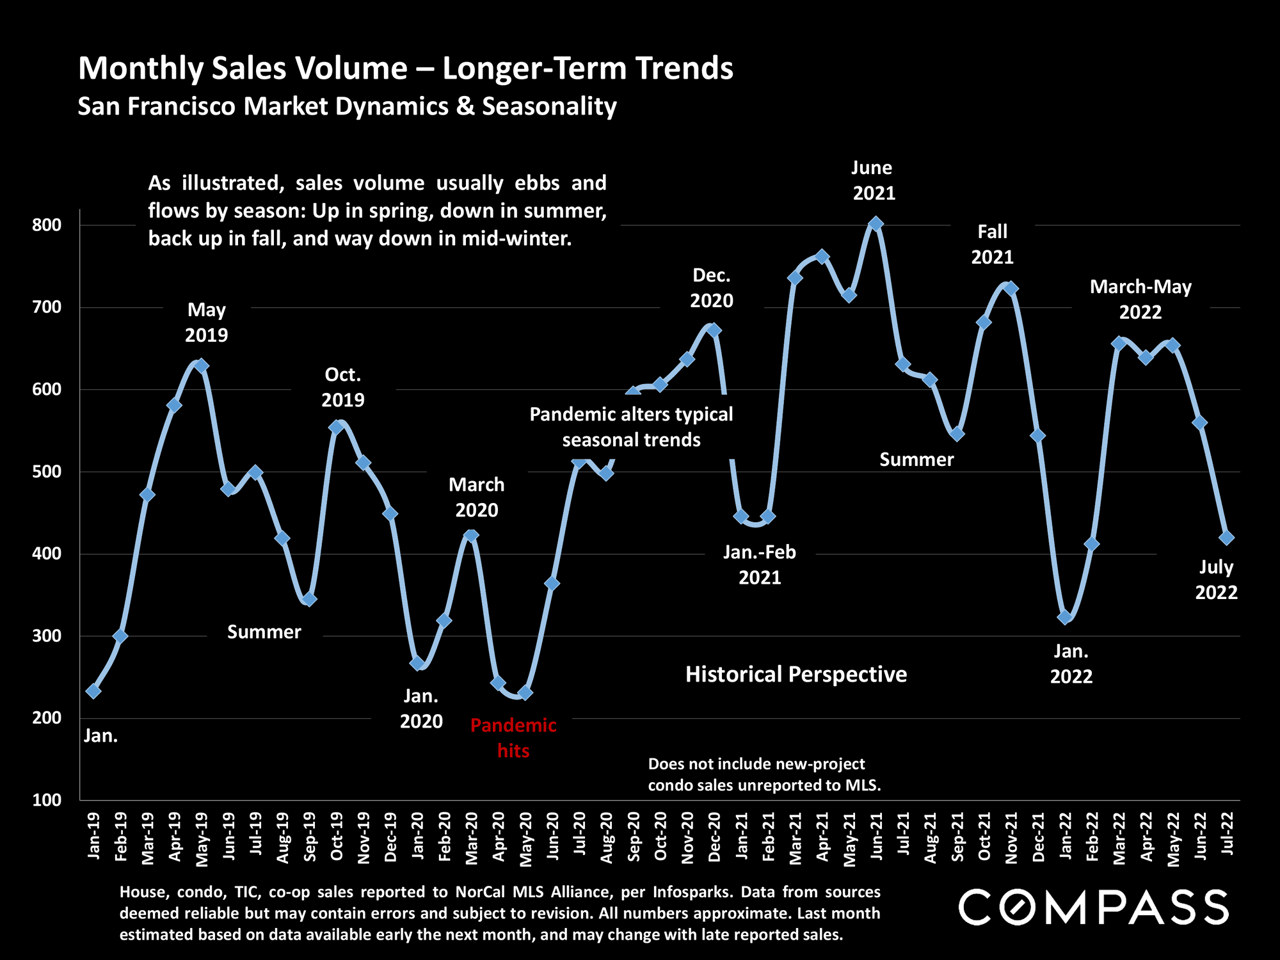
Chart of San Francisco monthly home sales volume from 2019 to 2022, with seasonal trends and pandemic annotations.
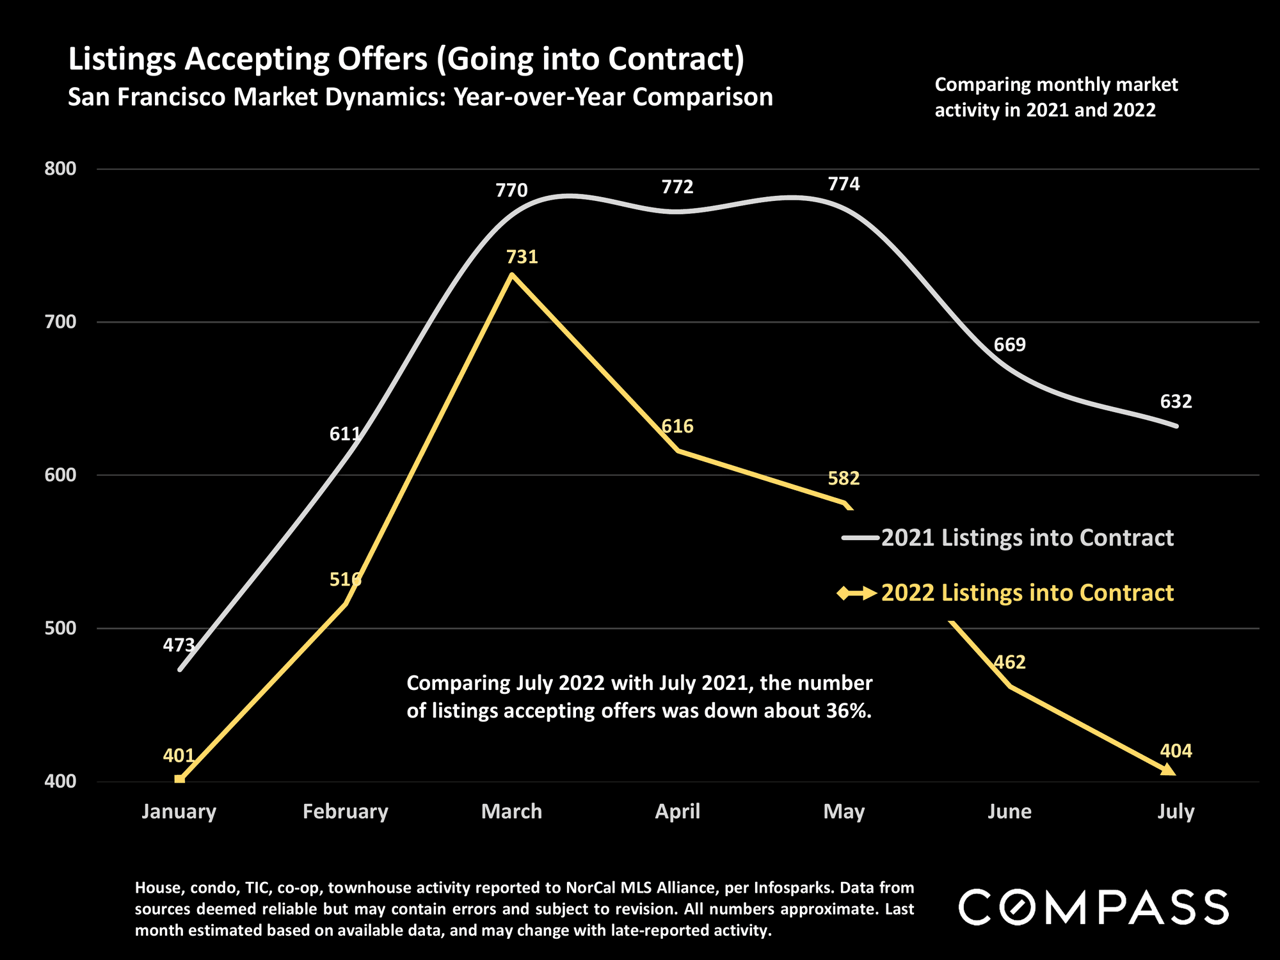
San Francisco chart comparing listings going into contract in 2021 and 2022, with July 2022 down 36%.
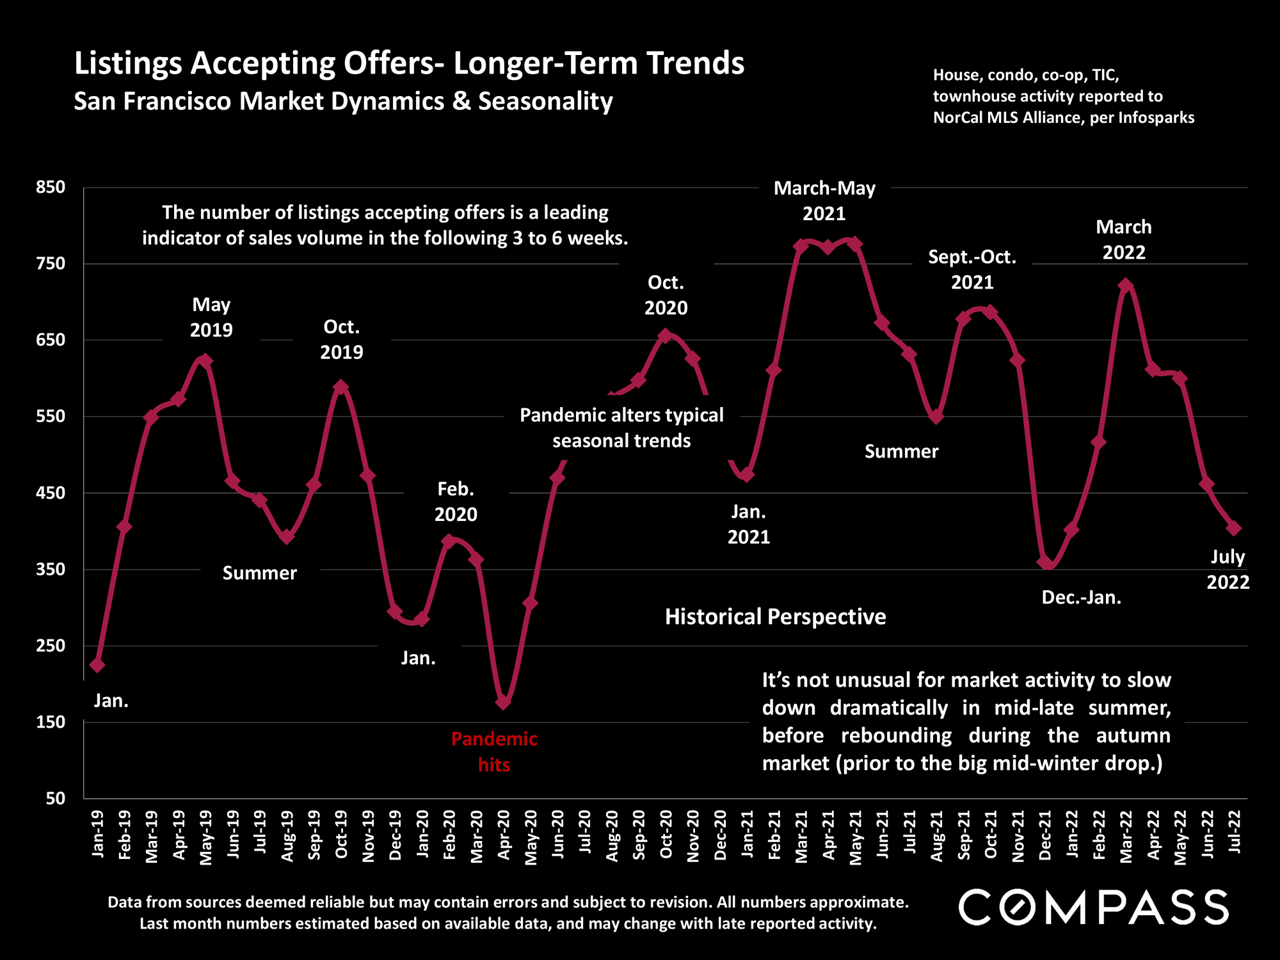
Chart of San Francisco listings accepting offers, with magenta seasonal trends from 2019 through July 2022.
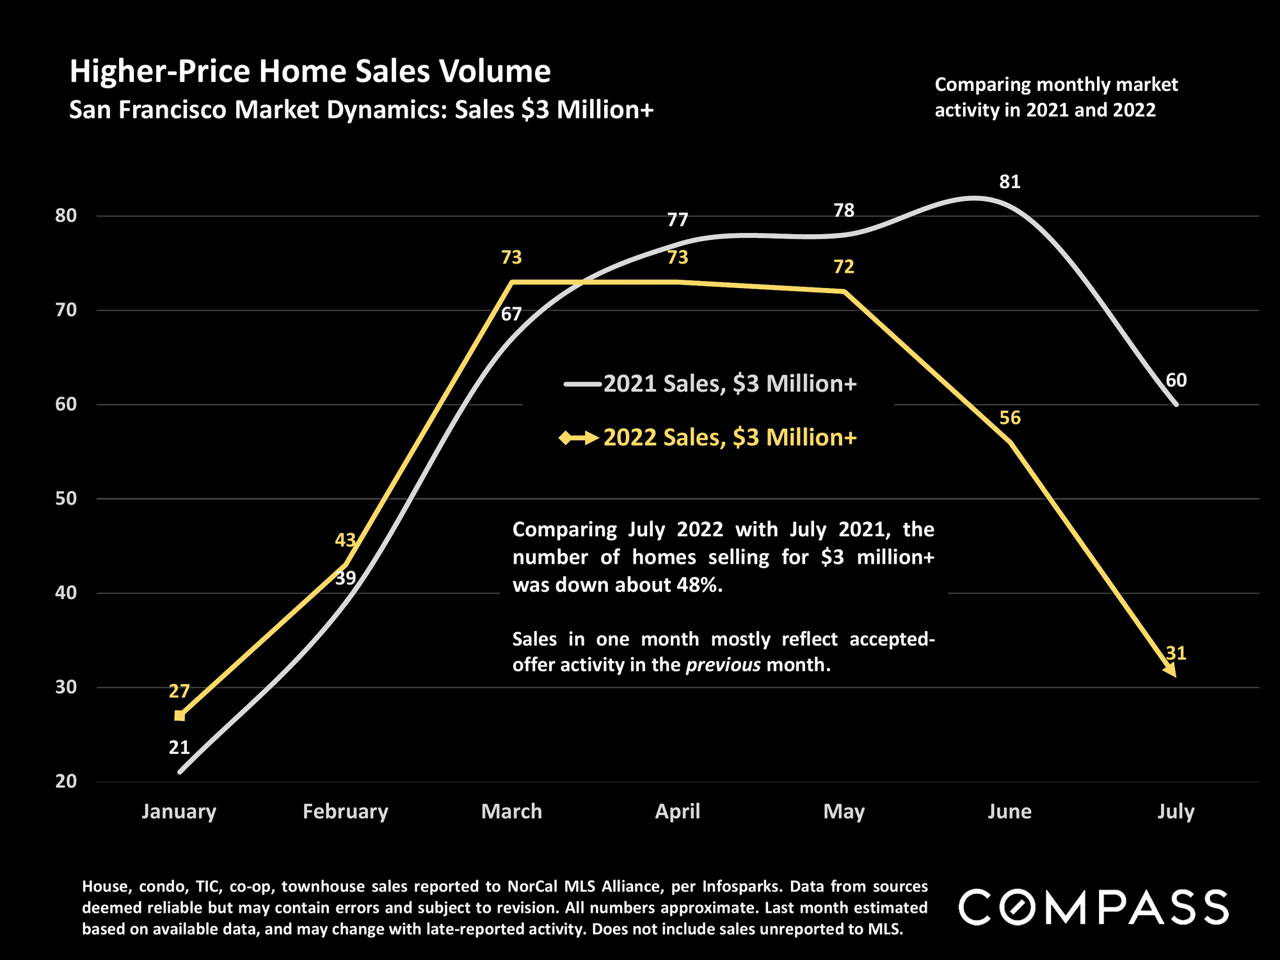
Chart comparing monthly San Francisco home sales above $3 million in 2021 and 2022; July 2022 falls to 31.
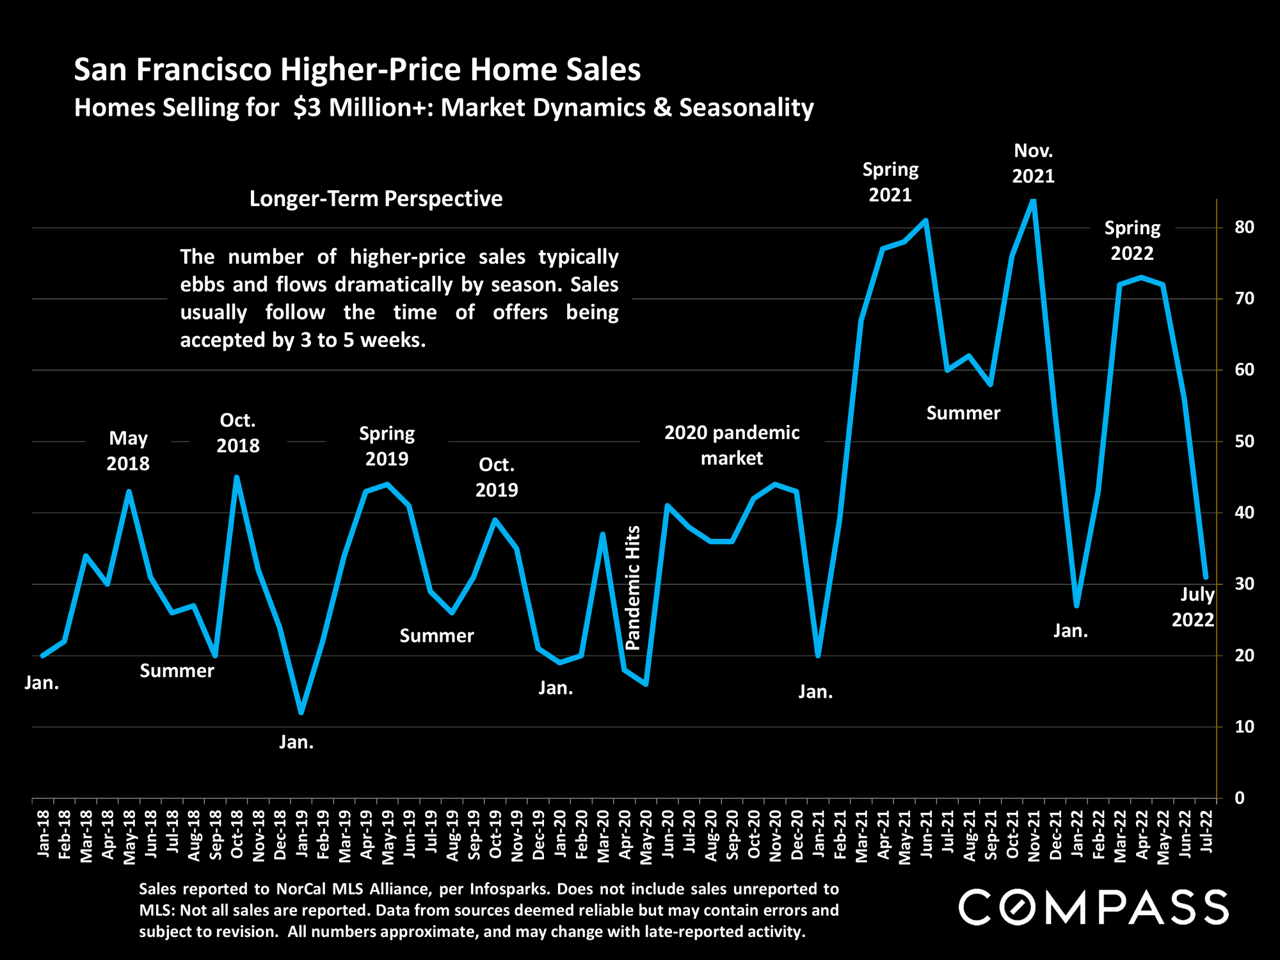
Chart of San Francisco $3 million-plus home sales from 2018 to 2022, with seasonal peaks and a sharp rise in 2021.
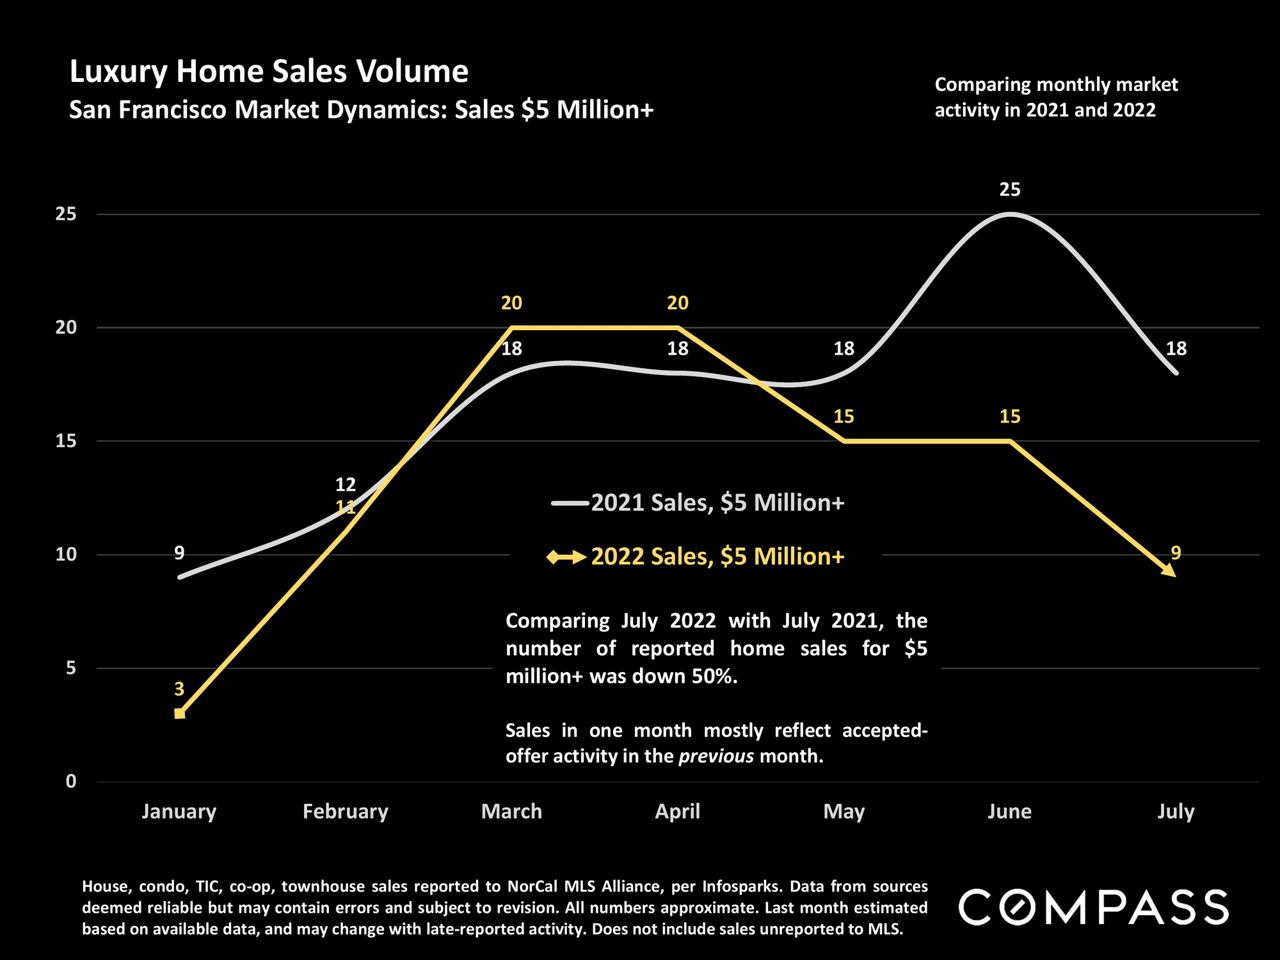
Line chart comparing monthly San Francisco home sales over $5 million in 2021 and 2022.
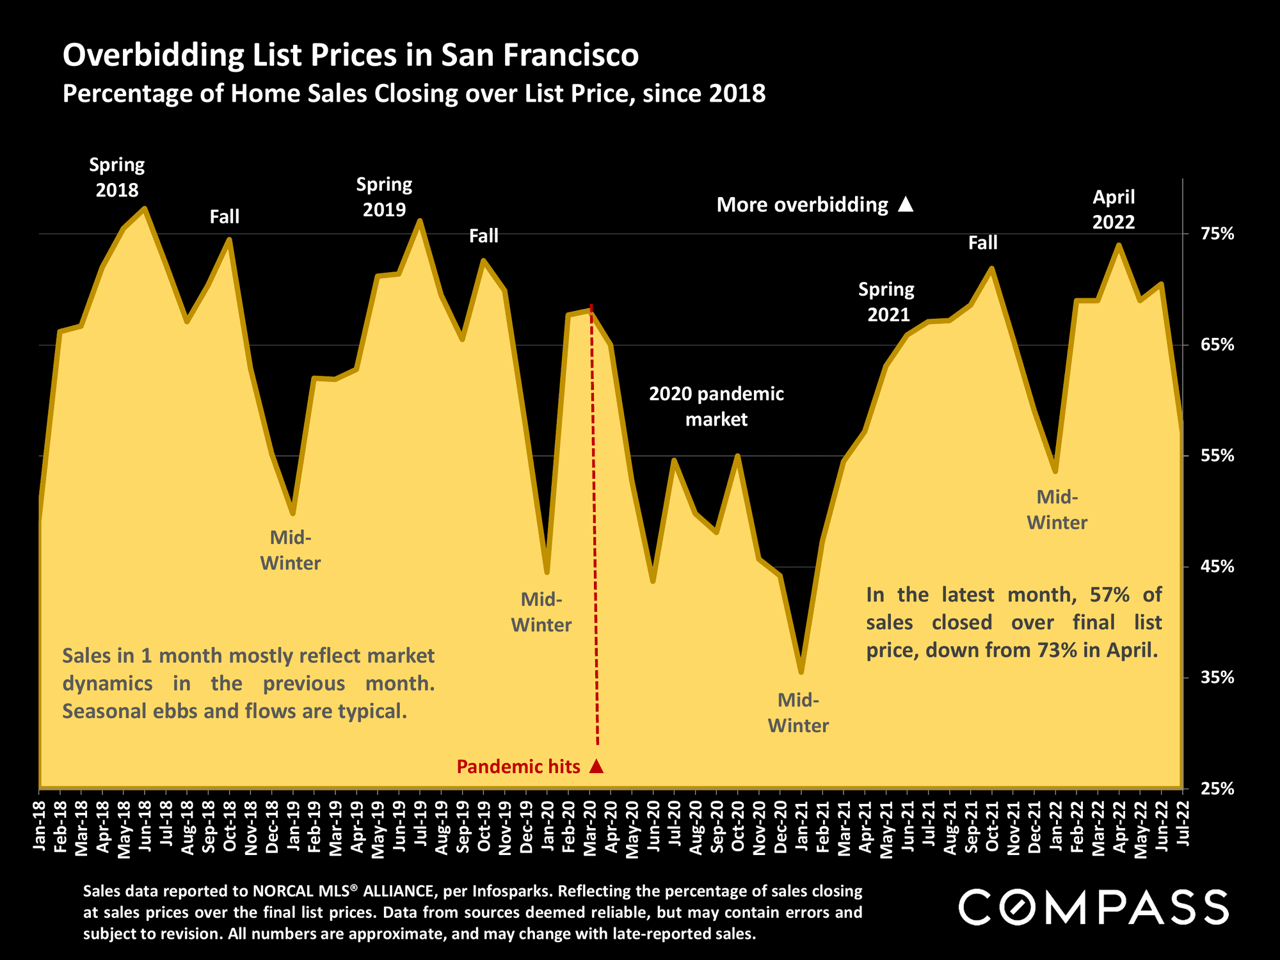
Chart of San Francisco home sales closing over list price, with monthly percentages from 2018 to 2022.
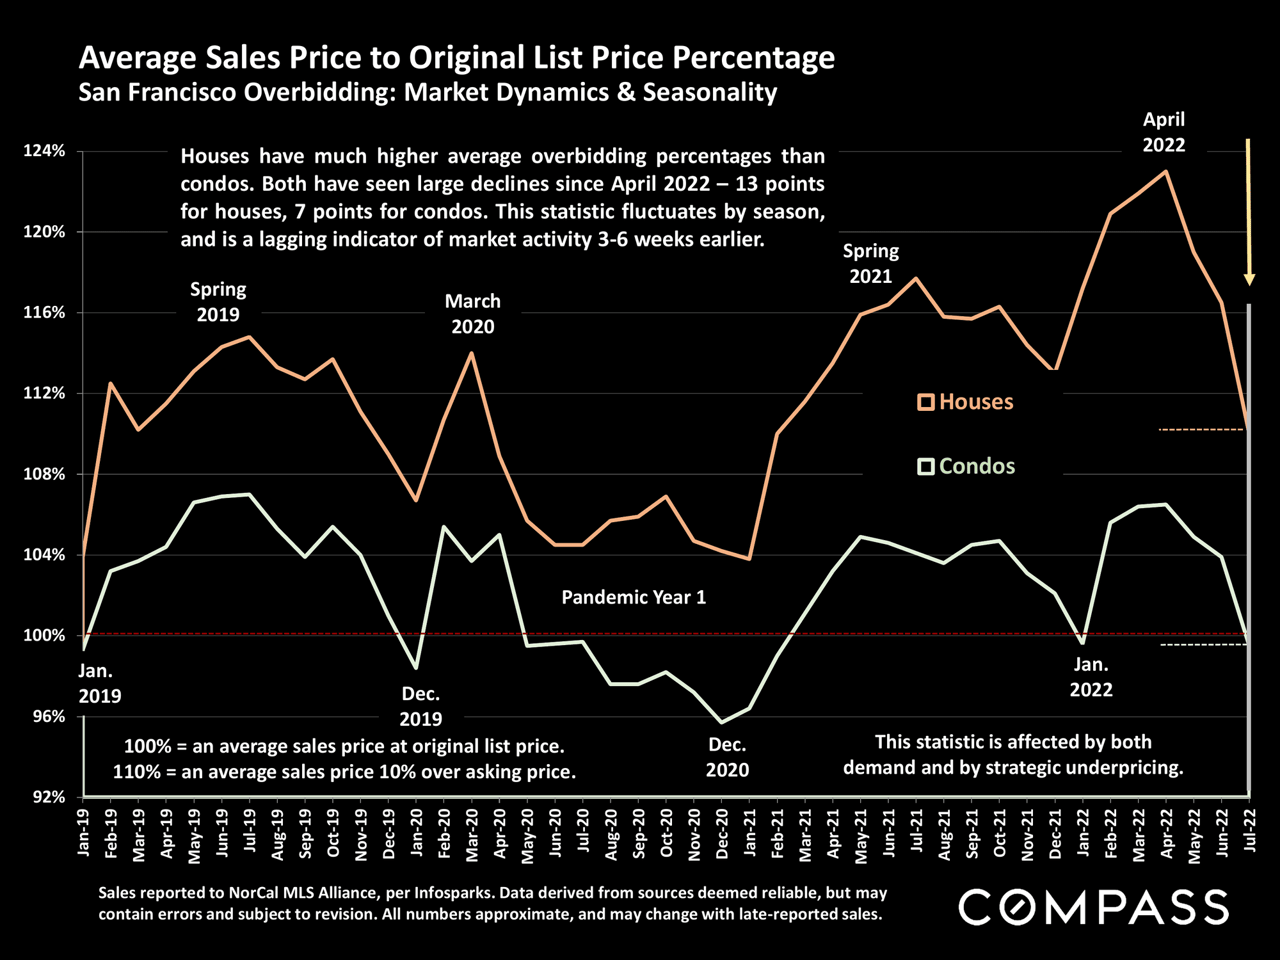
Line chart compares San Francisco house and condo sale prices to original list prices, January 2019–July 2022.
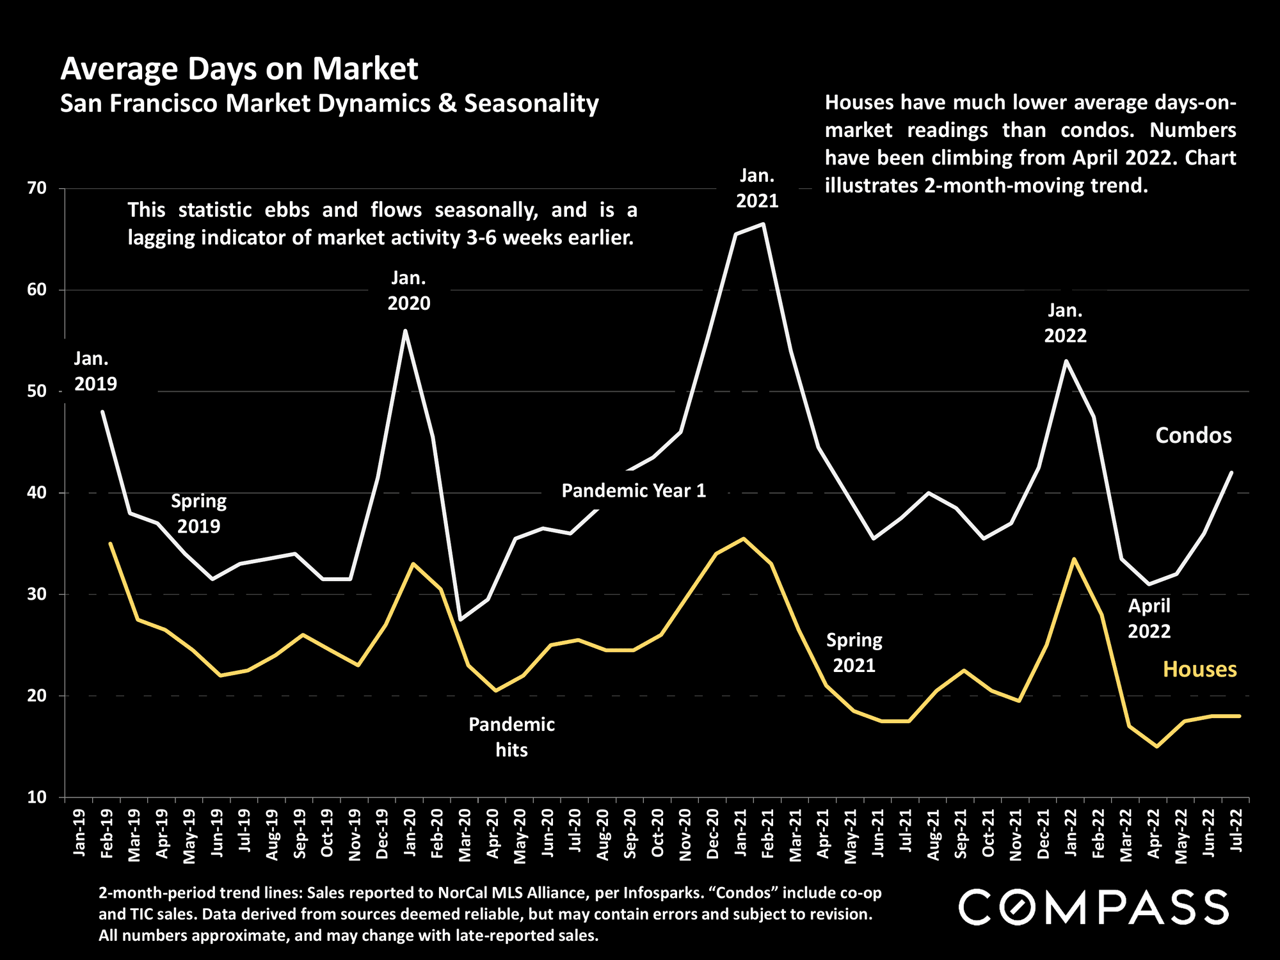
San Francisco average days on market chart, comparing houses and condos from 2019 to 2022.
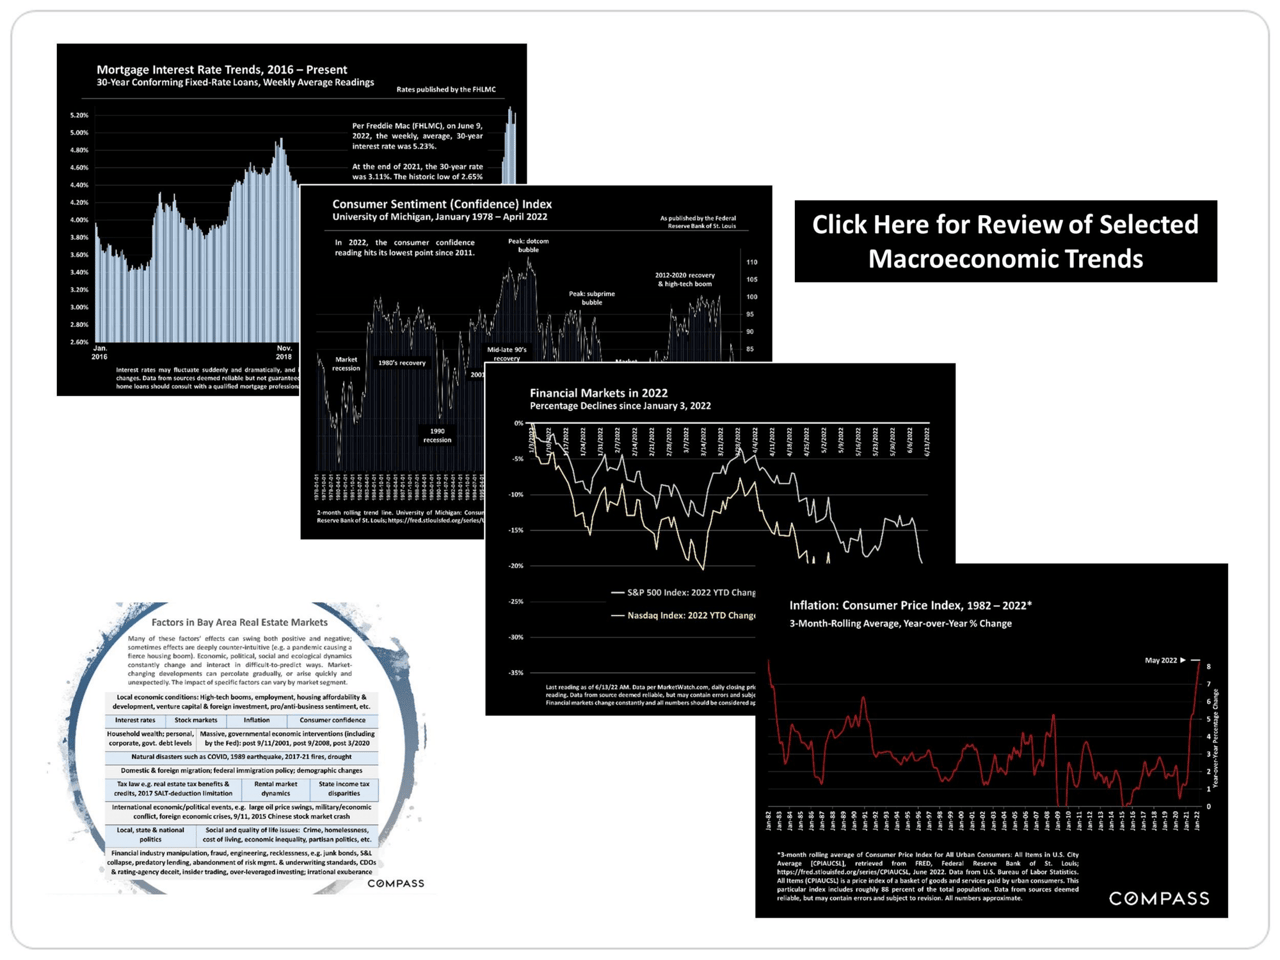
Market report graphic with economic charts and a table of factors affecting Bay Area real estate markets.
San Francisco Bay Area real estate survey graphic featuring the Golden Gate Bridge and a link to the full report.
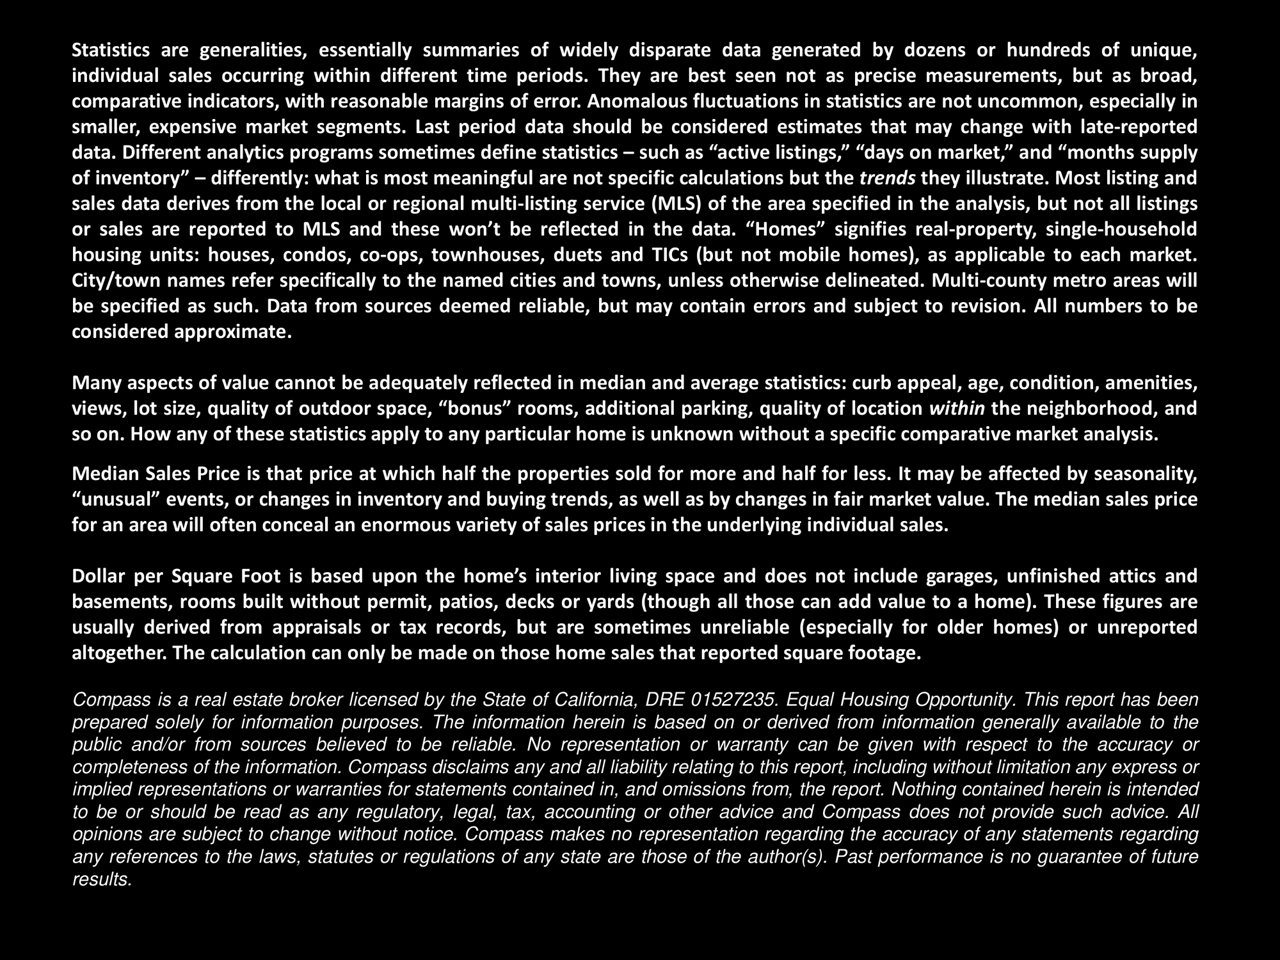
Market report notes explaining real estate statistics, median sales price, square-foot pricing, and Compass’s disclaimer.
Golden Gate Bridge towers emerge from dense fog in San Francisco.

Let’s Work Together

I love people and connecting with new opportunities. Let's talk about what's next for you, wherever you call home.